
The idea that we are late in the economic and financial-market cycle is one that even most Wall Street bulls won’t dispute.
After all, when the economic expansion surpasses a decade to become the longest ever and the S&P 500 has delivered a compounded return of nearly 18% a year since March 2009, how can the cycle not be considered pretty mature?
Yet it’s not quite that simple. Huge parts of the economy have run out of sync, at separate speeds. Some indicators have a decidedly “good as it gets” look, others retain a mid-cycle profile — and a few even resemble early parts of a recovery than the end. Friday’s unexpectedly strong November job gain above 200,000 reflects this debate, suggesting we are not at “full employment” even this deep into an expansion.
And the market itself has stalled and retrenched several times along the way, keeping risk appetites tethered and purging or preventing excesses.
In the “late-cycle” category we find several broad, trending data readings: Unemployment rate and jobless claims at a 50-year low; consumer confidence hit a cycle peak and has flattened out; and the broad index of leading economic indicators has slipped from very high levels. Auto sales peaked a few years ago. Corporate debt levels are near extremes, profit margins have retreated from historic highs and equity valuations are certainly full and in line with the latter phases of prior bull markets.
But corporate-credit conditions are sturdy, and households have simply not loaded up on debt this cycle, in a long period of enforced and then voluntary sobriety after the massive credit boom and bust that culminated in 2008. This leaves consumers in good shape. And the housing market, a drag on growth for years after the crash, has now perked up and is feeding off supply-demand dynamics that are more typical of an early-cycle environment.
What about the yield curve?
The summertime inversion of the Treasury yield curve — in which longer-term bond yields slip below short-term rates after the Federal Reserve has been tightening policy for a while — crystallized the debate on the cycle’s effective age.
Such an inversion, in the past, has started the countdown to a recession — but sometimes with a lag as long as two years. This indicator has been translated into a recession-probability gauge one year ahead by the New York Fed.
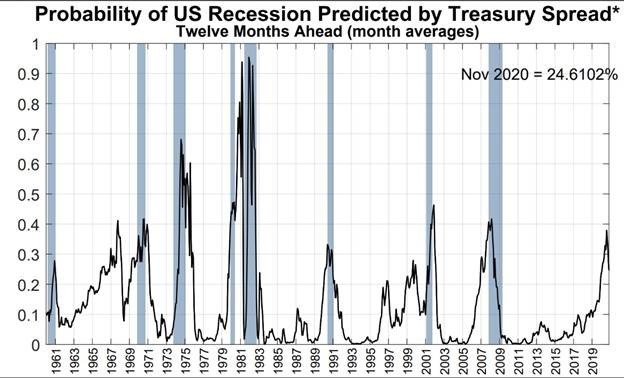
Source: New York Fed
It has turned lower since late summer as the yield curve has returned to its “normal” shape, but only in the 1960s has it ever climbed above 30% and fallen back to tame levels well ahead of any recession.
Have there even been enough cycles for this pattern to qualify as a statistically reliable “rule?” Do the extremely low absolute level of rates now (similar to the ’60s) change the interpretation? Was the inversion too shallow and short-lived to serve as a proper signal?
Whatever the answers, Jason Hunter, technical strategist at JP Morgan, notes that stocks have tended to have some of their strongest runs after an inversion, late in a cycle. “The longer-term bull cycles persisted for nearly two years after the initial [Treasury] curve inversion during the past three business cycles, with the majority of the late-cycle rally acceleration phases unfolding within the year after curve inversion.” The S&P on average has gained more than 20% over less than two years in the past four episodes before peaking.
One way to view the summer tumult is as the third severe “growth scare” of this expansion, following those of 2011-12 and 2015-16. Both brought with them nasty 15-20% equity downturns, new lows in Treasury yields and forced central banks to become more accommodative.
The Fed has referred to its shift from rate-hiking last year to three cuts this year as a “mid-cycle adjustment,” which would leave it on hold for now and summons happy memories of prior such Fed-enabled “soft landings.”
‘Still upside’ for stocks
Jurrien Timmer, head of global macro at Fidelity, has been tracking the current market performance against previous mid-cycle “mini-bear markets” of the ’90s and 2011.
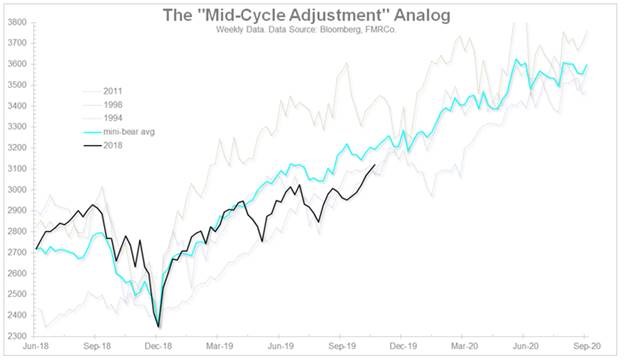
Source: Fidelity
Citing the recent upturn in global industrial surveys and central-bank pivots toward easier policy, Timmer says, “I’m not prepared to call it early cycle, but perhaps it’s a mini-reflation wave within an ongoing late cycle. Maybe the markets are whistling past the graveyard, but my sense is that this is the playbook right now.”
Citi’s Tobias Levkovich, says, “Our biggest concerns for the S&P 500 are more [second-half 2020] related, tied to the possibility of a business slowdown caused by management teams hunkering down prior to the elections, tighter [commercial] lending standards in October with a traditional nine-month lag, our margin lead indicator and the impact of the yield curve’s shape on volatility with a two-year lag… But in the interim there is still upside for equities even if such gains become more limited.”
Ned Davis Research, in its 2020 outlook, boils down four separate cycles — tied to the economy and earnings; Fed policy; the election-year cadence; and NDR’s own model of equity-market conditions and trend — to arrive at a year-ahead S&P target of 3225, up a few percent from here.
The fourth-quarter collapse in the S&P 500 last year amounted to a comprehensive flush for the market, pummeling the majority of stocks far worse than the indexes, resetting valuations to a five-year low and generating the highest investor-pessimism levels of this bull market. The reversal higher one year ago set off a rare “breadth thrust” signal of the sort more typically seen at the start of major market advances.
Now, the S&P is 34% higher with earnings just about flat and the trailing price/earnings multiple is near a cycle high above 20 and investor sentiment is far more optimistic. So perhaps the market is now priced for a glass-almost-full scenario rather than the end of a cycle. But if the market isn’t detecting signs of a recession, it tends to find a way to stay supported or work its way higher — even if fitfully, and shadowed by constant end-of-cycle warnings.
Courtesy of CNBC

Comments