
Read More, Comment and Share......
StockBuz's Posts (693)
Sort by
H/T Ryan
Read More, Comment and Share......
Wall Street’s reaction to hotter-than-estimated inflation data suggested growing bets the Federal Reserve has a long ways to go in its aggressive tightening crusade, making the odds of a soft landing look slimmer.
After a lengthy period of subdued equity swings, volatility has been gaining traction. That doesn’t bode well for a market that’s gotten more expensive after an exuberant rally from its October lows. Stock gains have been dwindling by the day amid fears that a recession in the world’s largest economy could further hamper the prospects for Corporate America.
A slide in the S&P 500 Friday added to its worst weekly selloff since early December. The tech-heavy Nasdaq 100 tumbled about 2% as the Treasury two-year yield topped 4.8%, the highest since 2007. The dollar climbed. Swaps are now pricing in 25 basis-point hikes at the Fed’s next three meetings, and bets on the peak rate rose to about 5.4% by July. The benchmark sits in a 4.5%-4.75% range.
“There’s little room for upside in stocks right now given the inflation news, current market valuations after the January rally, and a weak Q4 earnings season,” Brian Overby, senior markets strategist at Ally. “The ‘no landing’ view is quickly becoming more of a ‘bumpy landing’ view with the concept of higher interest rates for longer settling in.”
The unexpected acceleration in the personal consumption expenditures gauge underscored the risks of persistently high inflation. Furthermore, resilient spending paired with the exceptional strength of the labor market will make it tougher for the Fed to get inflation to its 2% goal. Separate data showed US consumer sentiment rose to the highest in a year while new home sales topped forecasts.
Officials may need to raise rates as high as 6.5% to defeat inflation, according to new research that was critical of the central bank’s initially slow response to rising prices. In a paper presented Friday in New York, a quintet of Wall Street economists and academics argue that policymakers have an overly-optimistic outlook and will need to inflict some economic pain to get prices under control.
Read: Fed Officials Flag Risk of Sticky Inflation as PCE Comes in Hot
Mohamed El-Erian says financial markets are starting to doubt whether the Fed can bring inflation down to its target.
“We’re seeing actual and survey indicators heading the wrong way,” El-Erian, the chairman of Gramercy Funds and a Bloomberg Opinion columnist told Bloomberg Television.
Cleveland Fed President Loretta Mester said a bigger-than-expected rise in the central bank’s preferred inflation gauge shows the need to keep raising rates, but stopped short of suggesting this warranted a step-up to a half-point hike. The report is “just consistent with the fact that the Fed needs to do a little more on our policy rate to make sure that inflation is moving back down,” she added.
As investors position for the risk that the Fed persists with hawkish policy moves, they have been dumping equities and cash alike in favor of bonds, Bank of America Corp. strategists said.
Global equity funds lost $7 billion in outflows in the week through Feb. 22, while $3.8 billion left cash funds, according to a note from the bank, which cited EPFR Global data. At $4.9 billion, bonds drew additions for an eighth straight week in the longest such streak since November 2021, the team led by Michael Hartnett said.
David Donabedian, chief investment officer of CIBC Private Wealth US:
“So the bullish narrative that the market had coming into the year of slowing economy headed toward a soft landing and slowing inflation allowing the Fed to stop raising rates ASAP, that’s been blown up here by the data. My view is that the market rally that we’ve seen since October was a bear-market rally.”
Peter van Dooijeweert at Man Solutions:
“Today’s PCE data is a little bit more than the market wants to deal with. It’s fine to have rising rates off good economic data and avoiding a hard landing. It’s just not okay for the market to have to grapple with a return to rising inflation.”
Greg Wilensky, head of US fixed income at Janus Henderson:
“This was not the news the Fed or investors had been hoping for and, as such, we expect markets to adjust to the likelihood that the Fed will need to raise rates higher, and keep them higher for longer, than they had been pricing in previously. Viewing the hotter inflation data together with continued strength in the labor market and consumer spending implies that the Fed still has work to do. It appears investors will have to wait a little longer for the much-anticipated Fed pause.”
Krishna Guha, vice chairman at Evercore:
“The likelihood of achieving a soft landing dips, with the risk of no-landing potentially forcing the Fed to push rates higher and hold longer, with greater risk that this ultimately pushes the economy into a mild recession. So risk-off pure and simple. We still think the Fed is not likely to return to 50bp hikes, though that risk has nudged up with the latest data.”
Chris Zaccarelli, chief investment officer at Independent Advisor Alliance:
“It is much too soon for the Fed to say ‘mission accomplished.’ It is far too early to extend duration and buy the dips in bond prices, let alone trying to continue to buy the dips in the stock market. We have been exercising much more caution and have advised our clients to be careful and not aggressive at this point in the economic cycle.”
Peter Boockvar, author of the Boock Report:
“Bottom line, Treasury yields are moving higher in response to the higher than expected inflation stats and reminder that while the trend will still be down, it will still take time to get to some Fed comfort level. Either way, at least looking at the core PCE, we FINALLY have ZERO real interest rates. I know some are still trying to figure out how many hikes the Fed has left, but it’s not many and AGAIN, higher rates for a longer time frame should be the focus.”
Jeffrey Roach, chief economist at LPL Financial:
“The Fed may still decide to hike by 0.25% at the next meeting but this report means that the Fed will likely continue hiking into the summer. Markets will likely stay choppy during these months where higher rates have yet to materially cool consumer spending.”
Money managers are fortifying portfolios and hedging the risk of a prolonged inflation fight by sticking to credit maturing in just a few years.
Some funds are actively cutting so-called duration, a measure of sensitivity to interest rates, to limit the fallout if central banks keep hiking to tackle inflation. Others are simply focusing on short-dated notes as the additional yield they get from longer securities is too small to justify the risk of a slump when rates rise.
In corporate news, Boeing Co. sank after pausing deliveries of its 787 Dreamliner over a documentation issue with a fuselage component. Carvana Co. slumped on a much wider loss than Wall Street had expected for the used-car retailer. Beyond Meat Inc. surged on sales that exceeded expectations and the plant-based meat maker showed progress toward its goal of becoming profitable.
On the geopolitical front, the US will impose a 200% tariff on all imports of Russian-made aluminum, as well as aluminum products made with metal smelted or cast in the country, in a move that could ripple through global manufacturing supply chains.
Treasury Secretary Janet Yellen warned China and other nations against providing material support to Russia, saying any such actions would amount to an evasion of sanctions and would “provoke very serious consequences.”
Elsewhere, the yen retreated as Bank of Japan Governor nominee Kazuo Ueda warned against any magical solution to produce stable inflation and normalize policy as he largely stuck to the existing central bank script in the first parliamentary hearing to approve his appointment.
Courtesy of Bloomberg and Yahoo
Read More, Comment and Share......

iStock via Getty Images
- Things appear to be getting worse, not better, along the global supply chain, which was upended by the coronavirus pandemic over a year ago. That means entire companies and industries are going to have to deal with more extremes for the foreseeable future, making business investment a shaky decision that compounds the original problem. The volatility and uncertainty also destroy demand as prices become too high for consumers. The phenomenon, called the "bullwhip effect," could end up damaging the economy in the short-term, with violent swings in a range of goods. Seeking Alpha discussed the possibility back in May, but it looks like the situation is now in play.
- Warning bells: In an open letter to the United Nations General Assembly, business leaders from the International Chamber of Shipping, IATA and other transport groups (that account for more than $20T of annual global trade) sounded the alarm on the risks of a supply chain meltdown. "We are witnessing unprecedented disruptions and global delays and shortages on essential goods including electronics, food, fuel and medical supplies. Consumer demand is rising and the delays look set to worsen ahead of Christmas and continue into 2022. Our calls have been consistent and clear: freedom of movement for transport workers, for governments to use protocols that have been endorsed by international bodies for each sector and to prioritize transport workers for vaccinations... before global transport systems collapse."
- Some of the effects were on display this week as three more U.K. energy companies were pushed out of business by sky-high natural gas prices. China is also considering raising power prices for factories as an energy shortage there has unleashed turmoil in commodities markets and prompted silicon makers to dramatically slash production. Over in the U.S., the Commerce Department delayed a decision on solar tariffs with the price of panels set to rise, while Dollar Tree (NASDAQ:DLTR) said it would sell more items above $1 to offset cost increases on a range of goods.
- Do something! This time around, higher prices have put central banks between a rock and a hard place. Inflation is traditionally fought off by raising interest rates, but that might not be effective at the present given the supply chain issues taking place across the globe and the stage in the economic recovery. On the other hand, if easy monetary policy is left in place, price pressures could be compounded and result in a reduction in purchasing power or lead the economy to overheat.
Courtesy of Seeking Alpha
Read More, Comment and Share......
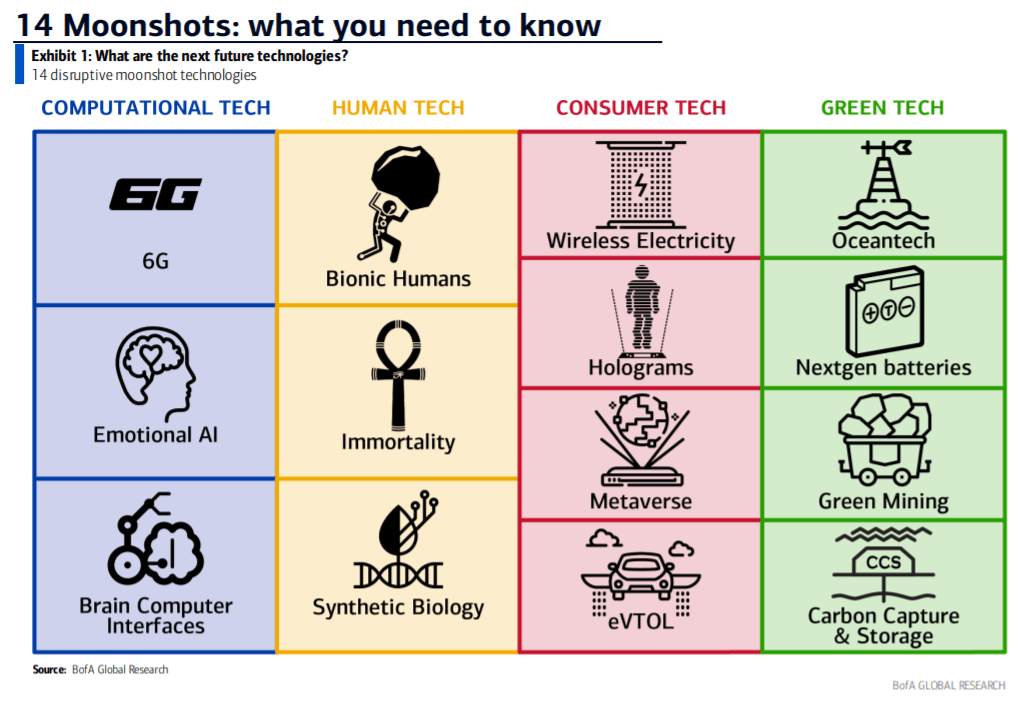
- "The pace at which themes are transforming businesses is blistering, but the adoption of many technologies - like smartphones or renewable energy - have surpassed experts’ forecasts by decades, because we often think linearly but progress occurs exponentially."
- BofA Global Research strategists led by Haim Israel release a 152-page research report identifying 14 "radical technologies that could change our lives and accelerate the impact of global megatrends."
- They have a $330B market size today that could grow to $6.4T by the 2030s, Israel says.
- "These moonshots could transform and disrupt multiple industries, contributing to the next big cycle of technology-driven growth."
- The 14 are:
- 6G: "The next generation of telecom networks will be needed in less than a decade as data continues to grow exponentially and 5G reaches its upper limit capacity."
- Brain Computer Interfaces: "As we reach a point where humans are unable to keep up with computers and AI, brain computer interfaces could help ‘level up’ humans with computers. Shorter term, brain computer interfaces hold solutions for paralyzed individuals and promise a new wave of innovation in gaming."
- Emotional Artificial Intelligence: Also "known as 'Affective Computing' and 'Cognitive Computing' (it) is designed to capture, analyze and respond to human emotions and simulate human thoughts. EAI can potentially collect, analyze and respond to completely new varieties of data and situations and predict or simulate human thought, leading people to take action."
- Synthetic Biology: "At its core, 'synbio', as the field is commonly referred to, takes advantage of the vast diversity of nature to make biomolecules that traditional chemistry cannot."
- Immortality: "Traditionally, aging has not been viewed as a disease that can be treated but this is changing. Actors in this space are increasingly looking to tackle the hallmark of aging via pathways such as ‘genomic instability, telomere attrition, mitochondrial dysfunction, and cellular senescence’ among others."
- Bionic humans: "This could be invasive (e.g. implants) or non-invasive (e.g. exoskeleton). Biohacking is also an associated field which is essentially applying DIY biology to boost oneself e.g. RFID chip in hand for contactless payments."
- eVTOL: "Electrical vertical take-off and landing vehicles that could provide an alternative mobility transportation solution to outdated infrastructure and overly stressed roads in urban settings."
- Wireless Electricity: "As the IoT takes off, automating and creating near continuous charging solutions could provide convenience for consumers, while solving charging problems for the rollout of EVs and secure electricity supplies for remote communities."
- Holograms: "A technology capable of creating a simulated environment through light imagery projections that will allow everyone to come together in one virtual room, without having to leave their physical location."
- Metaverse: A "future iteration of the Internet, made up of persistent, shared, 3D-shared spaces linked into a virtual universe. It could comprise countless persistent virtual worlds that interoperate with one another, as well as the physical world and transforming markets such as gaming, retail, entertainment etc."
- Nextgen Batteries: "Whilst lithium batteries are the major EV technology, this does not necessarily need to stay true with alternatives such as solid state, vanadium flow, sodium ion etc provide promising additional attributes."
- OceanTech: "It seeks to answer: ‘How do we increase sustainability of the ocean economy while harnessing its benefits?’ Solutions could include ocean energy, land-based aquaculture, and precision fishing using AI, etc."
- Green Mining: "Transitioning away from a carbon-intensive economy will mean moving to a metal-intensive one. Green mining solutions like deep-sea mining, agromining, mining of wastewater and asteroid mining could provide less polluting and destructive solutions as the green economy’s thirst for metals grows."
- Carbon Capture & Storage: "All current zero-carbon pathways require some form of CO2 removal. CCS, alongside other geoengineering solutions, could act as part of the solution with long-term permanent removal of CO2 vs afforestation."
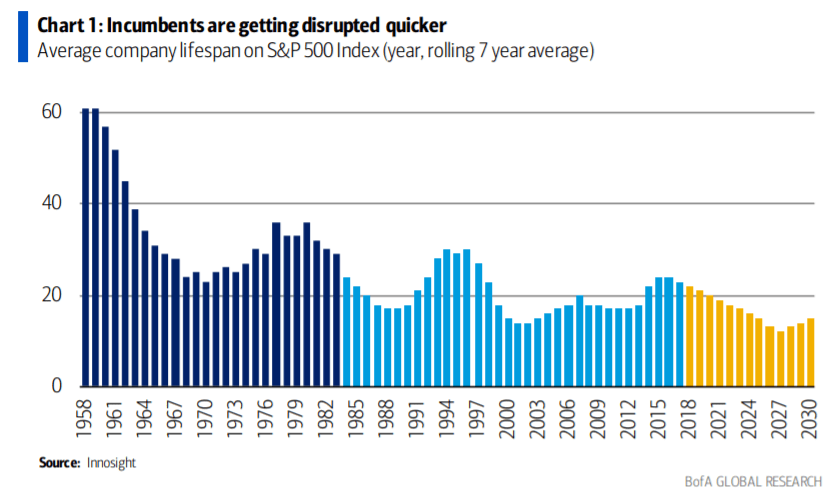
- Lower lifespan. The lifespan of S&P 500 (SP500) (NYSEARCA:SPY) incumbents is shortening and by 2027 components could last just 12 years before being replaced, BofA says.
- For Next Tech to succeed, first the innovation must have the potential to be economical, then it must solve a key problem or improve quality of life, and finally, there must be government support in some way.
- Risks to the 14 ideas include the tech not being commercially scalable, prohibitive costs outweighing the benefits and regulation limiting applicability.
- Several S&P sectors stand to benefit from the moonshots listed above.
- Communication Services (NYSEARCA:XLC), Health Care (NYSEARCA:XLV) and Info Tech (NYSEARCA:XLK) should see the most advantages, according to BofA.
- Real Estate (NYSEARCA:XLRE) would be the hardest hit with a move to the virtual world.
- Cathie Wood, whose ARK Invest funds focus on disruptors, held her monthly webinar on Tuesday.
- Courtesy of: Seeking Alpha
Read More, Comment and Share......
 Bitcoin’s Latest Crash: Not the First, Not the Last
While bitcoin has been one of the world’s best performing assets over the past 10 years, the cryptocurrency has had its fair share of volatility and price corrections.
Using data from CoinMarketCap, this graphic looks at bitcoin’s historical price corrections from all-time highs.
With bitcoin already down ~15% from its all-time high, Elon Musk’s tweet announcing Tesla would stop accepting bitcoin for purchases helped send the cryptocurrency down more than 50% from the top, dipping into the $30,000 price area.
“Tesla has suspended vehicle purchases using Bitcoin. We are concerned about rapidly increasing use of fossil fuels for Bitcoin mining and transactions, especially coal, which has the worst emissions of any fuel.”
– @Elonmusk
Crypto Cycle Top or Bull Run Pullback?
It’s far too early to draw any conclusions from bitcoin’s latest drop despite 30-40% pullbacks being common pit stops across bitcoin’s various bull runs.
While this drop fell a bit more from high to low than the usual bull run pullback, bitcoin’s price has since recovered and is hovering around $39,000, about a 40% drop from the top.
Whether or not this is the beginning of a new downtrend or the ultimate dip-buying opportunity, there has been a clear change in sentiment (and price) after Elon Musk tweeted about bitcoin’s sustainability concerns.
The Decoupling: Blockchain, not Bitcoin
Bitcoin and its energy intensive consensus protocol “proof-of-work” has come under scrutiny for the 129 terawatt-hours it consumes annually for its network functions.
Some other cryptocurrencies already use less energy-intensive consensus protocols, like Cardano’s proof-of-stake, Solana’s proof-of-history, or Nyzo’s proof-of-diversity. With the second largest cryptocurrency, Ethereum, also preparing to shift away from proof-of-work to proof-of-stake, this latest bitcoin drop could mark a potential decoupling in the cryptocurrency market.
In just the past two months, bitcoin’s dominance in the crypto ecosystem has fallen from over 70% to 43%.
| Date | Bitcoin Dominance | Ethereum Dominance | Other Cryptocurrency |
|---|---|---|---|
| End of 2020 | 70.98% | 11.09% | 17.93% |
| January | 63.09% | 15.39% | 21.52% |
| February | 61.73% | 11.96% | 26.31% |
| March | 60.19% | 12.14% | 27.67% |
| April | 50.18% | 14.92% | 34.90% |
| May | 43.25% | 18.59% | 38.16% |
Source: TradingView
While the decoupling narrative has grown alongside Ethereum’s popularity as it powers NFTs and decentralized finance applications, it’s worth noting that the last time bitcoin suffered such a steep drop in dominance was the crypto market’s last cycle top in early 2018.
For now, the entire crypto market has pulled back, with the total cryptocurrency space’s market cap going from a high of $2.56T to today’s $1.76T (a 30% decline).
While the panic selling seems to have finished, the next few weeks will define whether this was just another dip to buy, or the beginning of a steeper decline.
Courtesy of Visualcapitalist
Read More, Comment and Share......
From the bottom in late March of last year, the U.S. stock market was up nearly 75%. This was the best 12 month return ever recorded since 1950.
Nearly 96% of stocks in the overall U.S. stock market showed positive returns in that time.
It’s highly like we will never experience a 12 month period of returns like that again in our lifetime. For all intents and purposes, the one year period following the bottom of the Corona Crash was the easiest environment in history to make money in the stock market.
If you think this type of market is normal, you’re sorely mistaken. It’s not always going to be this easy.
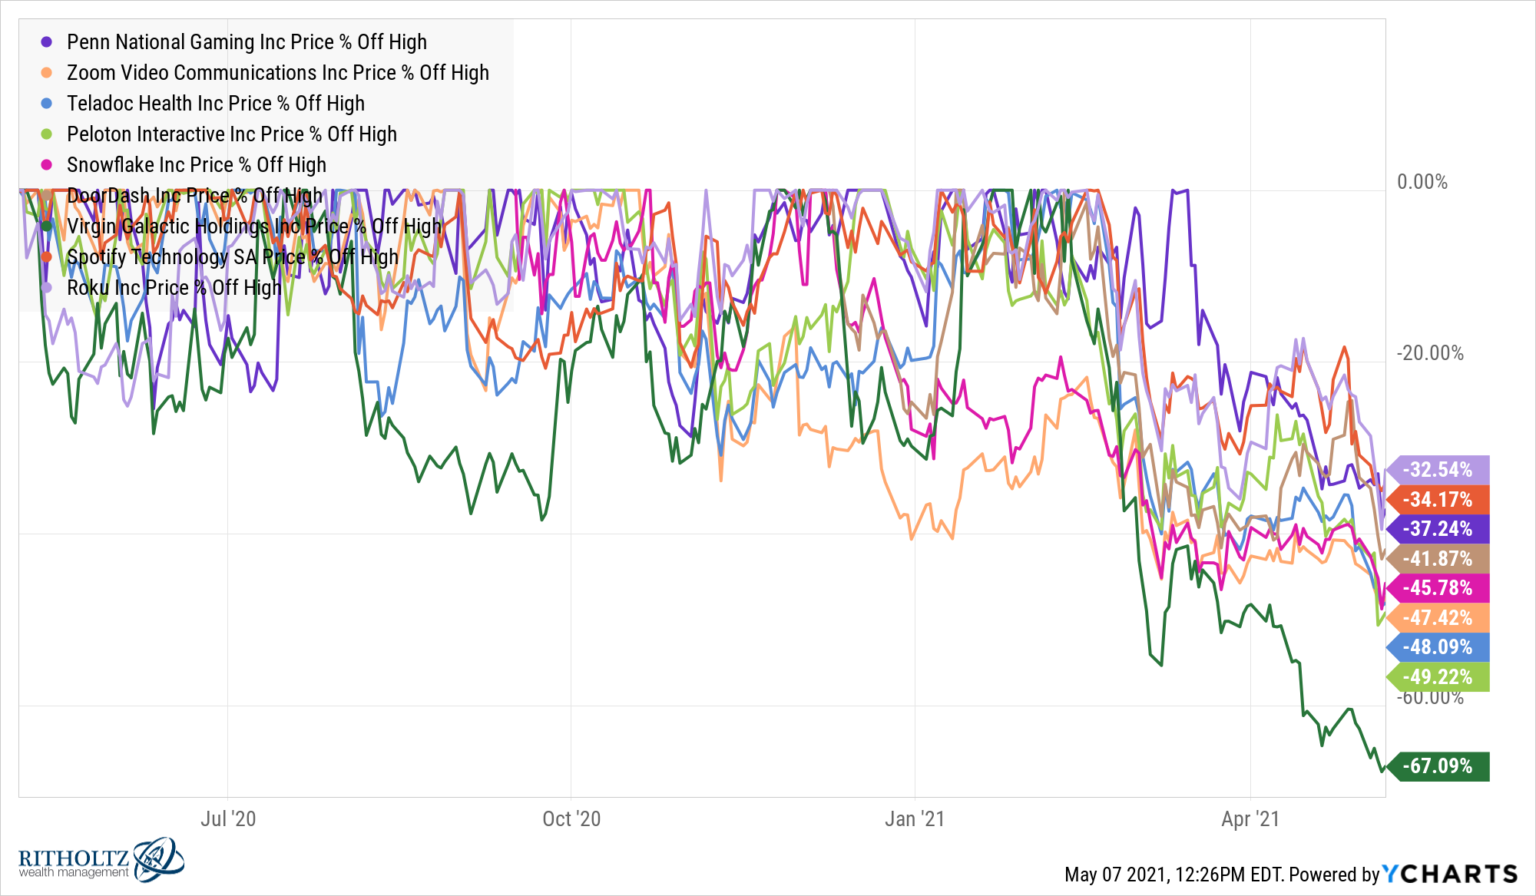
In fact, the stock market has already stopped being so easy in 2021. While the S&P 500 just hit its 26th new all-time high this year alone (including another new high at the close on Friday), a number of stocks are currently getting crushed.
And it’s not just any stocks; it’s many of the stocks retail investors flocked to last year following the crash:
 https://awealthofcommonsense.com/wp-content/uploads/2021/05/PENN_ZM_TDOC_PTON_SNOW_DASH_SPCE_SPOT_ROKU_chart-300x175.png 300w, https://awealthofcommonsense.com/wp-content/uploads/2021/05/PENN_ZM_TDOC_PTON_SNOW_DASH_SPCE_SPOT_ROKU_chart-1024x598.png 1024w, https://awealthofcommonsense.com/wp-content/uploads/2021/05/PENN_ZM_TDOC_PTON_SNOW_DASH_SPCE_SPOT_ROKU_chart-768x448.png 768w, https://awealthofcommonsense.com/wp-content/uploads/2021/05/PENN_ZM_TDOC_PTON_SNOW_DASH_SPCE_SPOT_ROKU_chart-1536x896.png 1536w" alt="" width="2000" height="1167" />
2020 retail darlings such as Virgin Galactic (-67%), Peloton (-49%), Teladoc (-48%), Zoom (-47%), Snowflake (-46%), DoorDash (-42%), Penn National (-37%), Spotify (-34%) and Roku (-33%) are all getting massacred while the stock market is powering to new highs.
It is worth noting many of these stocks are still sitting on massive gains depending on when you got into them. This is a good reminder that no stock rises up and to the right on a straight line forever.
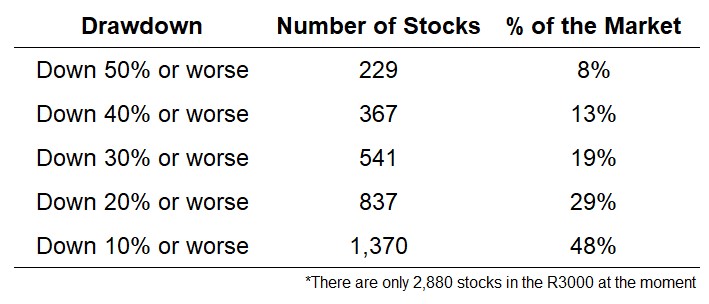
It’s also true that these popular names aren’t alone when it comes to the carnage in certain individual stocks right now.
Using data from YCharts, I drilled down into the Russell 3000 (a good proxy for the total U.S. stock market) to see how many stocks currently have double-digit drawdowns from their 52 week highs. The list was bigger than I expected:
 https://awealthofcommonsense.com/wp-content/uploads/2021/05/Screenshot-2021-05-08-233123-300x129.jpg 300w" alt="" width="489" height="210" />
The stock market is knocking out new highs on the regular and up 13% in 2021 but nearly one-third of all stocks are in a bear market as we speak. Almost half of all stocks are in correction territory, down 10% or more. And 1 out of every 12 stocks is down 50% from their 52 week highs right now.
But maybe I shouldn’t be so surprised about this data. This is actually the norm in the stock market.
Even when the stock market overall is up in a given year, there are almost always going to be a large number of stocks within the index that are down.
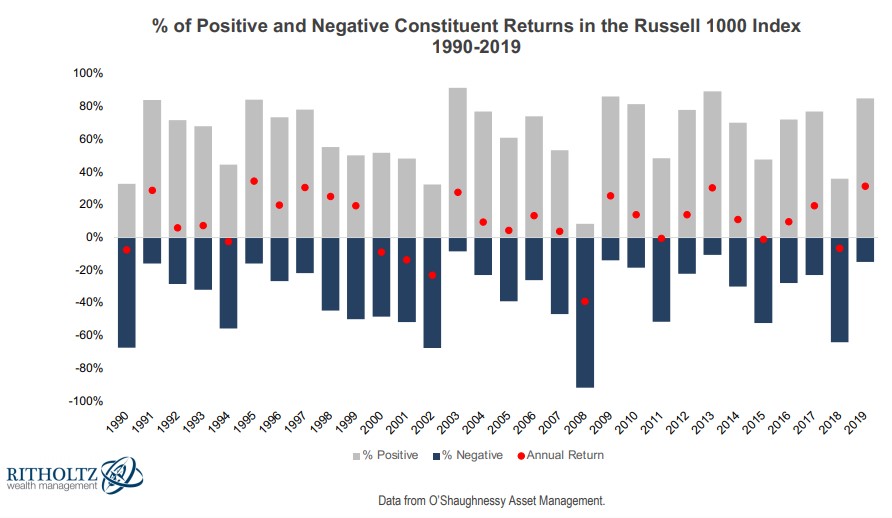
O’Shaughnessy Asset Management produced this excellent chart which shows the number of stocks with gains and losses each year from 1990 through 2019 along with the corresponding annual return for the Russell 1000 Index in that time:
 https://awealthofcommonsense.com/wp-content/uploads/2021/05/Screenshot-2021-05-07-114330-300x174.jpg 300w, https://awealthofcommonsense.com/wp-content/uploads/2021/05/Screenshot-2021-05-07-114330-768x446.jpg 768w" alt="" width="892" height="518" />
Even when the market is up there are always a number of stocks that are down.
For example, even in a blowout year like 2017, when the Russell 1000 was up almost 22%, nearly one-quarter of all stocks in the index experienced losses. There are no years when the index is up and no stocks are down. That’s how averages work in the stock market.
Market action from the bottom of the Corona Crash was the outlier. Investing in the stock market is rarely that easy.
The current environment is the norm.
If you own a handful of individual stocks that are getting killed at the moment, understand this is how it works.
Investing in individual stocks is hard. Large drawdowns are more frequent. Bigger gains are possible but so are bigger losses.
There are times when investing in index funds will make you feel like a fool. Then there are times when investing in individual stocks will make you feel like a fool.
Pick your poison.
Nothing works always and forever.
Courtesy of awealthofcommonsense
Read More, Comment and Share......
Read More, Comment and Share......
Hat tap GTNew
Read More, Comment and Share......
For those who have not followed David Einhorn's crusade against central bank money printing, and the epic bubble these cluless academic hacks have created, his views on the "enormous tech bubble" we are currently living through and published in his latest letter to investors of his Greenlight hedge fund (which returned 5.9% in Q3) will provide some unique perspective.
To everyone else who is familiar with how his fund has been hammered by his tech short basket - and especially Tesla - over the years as the most overvalued tech stocks in history continued to rip higher year after year, we doubt his latest thoughts will come as a surprise, although his observations on the endgame are certainly remarkable, if for no other reason that he now declared the time of death of said "enormous tech bubble" as Sept 2, 2020.
Bubbles tend to topple under their own weight. Everybody is in. The last short has covered. The last buyer has bought (or bought massive amounts of weekly calls). The decline starts and the psychology shifts from greed to complacency to worry to panic. Our working hypothesis, which might be disproven, is that September 2, 2020 was the top and the bubble has already popped. If so, investor sentiment is in the process of shifting from greed to complacency. We have adjusted our short book accordingly including adding a fresh bubble basket of mostly second-tier companies and recent IPOs trading at remarkable valuations
So without further ado, below we excerpt his key thoughts on the biggest asset bubble that the Fed has inflated:
* * *
We are now in the midst of an enormous tech bubble. We prematurely identified what we thought was a bubble in early 2016. Part of our thinking at the time was that the height of the 1999-2000 bubble was a once-in-a-career experience and that investors would not repeat that level of insanity. Clearly, we were mistaken.
Four years later, there is a consensus that we are in a bubble. Barron’s recently ran this on the cover:
All the signs of a bubble are there, including:
- an IPO mania;
- extraordinary valuations and new metrics for valuation;5
- a huge market concentration in a single sector and a few stocks;
- a second tier of stocks that most people haven’t heard of at S&P 500-type marketcapitalizations;
- the more fanciful and distant the narrative, it seems the better the stock performs;
- outperformance of companies suspected of fraud based on the consensus belief thatthere is no enforcement risk, without which crime pays;
- outsized reaction to economically irrelevant stock splits;
- increased participation of retail investors, who appear focused on the best-performing names;
- incredible trading volumes in speculative instruments like weekly call options andworthless common stock;6 and
- a parabolic ascent toward a top.
There are many anecdotes of toppy behavior. We will share one: We recently received a job application with the email subject, “I am young, but good at investments” from a 13-year-old who purports to have quadrupled his money since February.
Some analysts and commentators are comparing this bubble to the prior one. Have the valuations reached the prior insanity’s? Is the IPO mania just as large? Are the companies better today? Are they growing faster? Have the specific events that popped the last bubble happened? Are they likely to happen soon?
We believe these questions are a fool’s errand. The bubbles will never be exactly the same. In 2000, the Nasdaq peaked at 5,000. Why not 4,000? Why not 10,000? Or 20,000? Would there really have been a difference? If the Nasdaq had peaked at 3,500 instead of 5,000, the losses would have been 65% instead of 80%. Had it peaked at 3,500, it would be easier to argue that this bubble has surpassed that one. Had it peaked at 20,000, it would be easier to argue that there is still a long way to go. This analysis is arbitrary. Is a bubble only dangerous when it has exceeded the prior one on every metric?
What matters in a bubble is market psychology, not valuation. Valuation is irrelevant; that’s what makes it a bubble. Jeremy Grantham has done some of the best work on bubbles and by his criteria this one is a “Real McCoy.” The question at hand is where are we in the psychology of this bubble? On March 10, 2000, nobody knew that it was the top. Even by September 2000, it wasn’t clear. There was no obvious event that marked the top. Only in hindsight do people try to back fit an explanation.
Bubbles tend to topple under their own weight. Everybody is in. The last short has covered. The last buyer has bought (or bought massive amounts of weekly calls). The decline starts and the psychology shifts from greed to complacency to worry to panic. Our working hypothesis, which might be disproven, is that September 2, 2020 was the top and the bubble has already popped. If so, investor sentiment is in the process of shifting from greed to complacency. We have adjusted our short book accordingly including adding a fresh bubble basket of mostly second-tier companies and recent IPOs trading at remarkable valuations.
Courtesy of ZeroHedge
Read More, Comment and Share......
Read More, Comment and Share......
Read More, Comment and Share......
The Iran conflict notwithstanding, Mr. Market will do it's best to reassure you that everything will be fine. Only time will tell but I personally, would not want to enter any new positions here unless you're a daytrader. Not at 20x forward earnings already baked in. Watch the next plank of earning reports. Hedge if you are long any name...........except gold that is. I have a target of $1700 in a wave five count before a correction.
Read More, Comment and Share......
The idea that we are late in the economic and financial-market cycle is one that even most Wall Street bulls won’t dispute.
After all, when the economic expansion surpasses a decade to become the longest ever and the S&P 500 has delivered a compounded return of nearly 18% a year since March 2009, how can the cycle not be considered pretty mature?
Yet it’s not quite that simple. Huge parts of the economy have run out of sync, at separate speeds. Some indicators have a decidedly “good as it gets” look, others retain a mid-cycle profile — and a few even resemble early parts of a recovery than the end. Friday’s unexpectedly strong November job gain above 200,000 reflects this debate, suggesting we are not at “full employment” even this deep into an expansion.
And the market itself has stalled and retrenched several times along the way, keeping risk appetites tethered and purging or preventing excesses.
In the “late-cycle” category we find several broad, trending data readings: Unemployment rate and jobless claims at a 50-year low; consumer confidence hit a cycle peak and has flattened out; and the broad index of leading economic indicators has slipped from very high levels. Auto sales peaked a few years ago. Corporate debt levels are near extremes, profit margins have retreated from historic highs and equity valuations are certainly full and in line with the latter phases of prior bull markets.
But corporate-credit conditions are sturdy, and households have simply not loaded up on debt this cycle, in a long period of enforced and then voluntary sobriety after the massive credit boom and bust that culminated in 2008. This leaves consumers in good shape. And the housing market, a drag on growth for years after the crash, has now perked up and is feeding off supply-demand dynamics that are more typical of an early-cycle environment.
What about the yield curve?
The summertime inversion of the Treasury yield curve — in which longer-term bond yields slip below short-term rates after the Federal Reserve has been tightening policy for a while — crystallized the debate on the cycle’s effective age.
Such an inversion, in the past, has started the countdown to a recession — but sometimes with a lag as long as two years. This indicator has been translated into a recession-probability gauge one year ahead by the New York Fed.
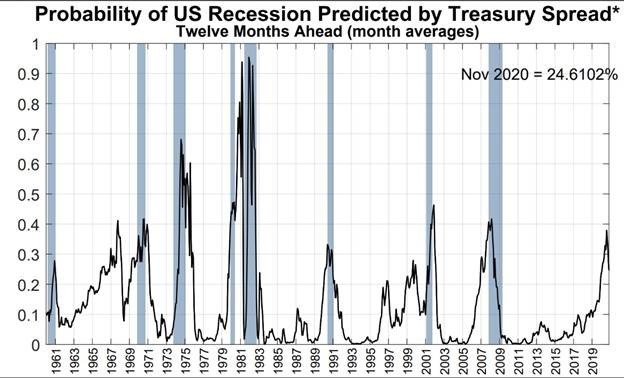
Source: New York Fed
It has turned lower since late summer as the yield curve has returned to its “normal” shape, but only in the 1960s has it ever climbed above 30% and fallen back to tame levels well ahead of any recession.
Have there even been enough cycles for this pattern to qualify as a statistically reliable “rule?” Do the extremely low absolute level of rates now (similar to the ’60s) change the interpretation? Was the inversion too shallow and short-lived to serve as a proper signal?
Whatever the answers, Jason Hunter, technical strategist at JP Morgan, notes that stocks have tended to have some of their strongest runs after an inversion, late in a cycle. “The longer-term bull cycles persisted for nearly two years after the initial [Treasury] curve inversion during the past three business cycles, with the majority of the late-cycle rally acceleration phases unfolding within the year after curve inversion.” The S&P on average has gained more than 20% over less than two years in the past four episodes before peaking.
One way to view the summer tumult is as the third severe “growth scare” of this expansion, following those of 2011-12 and 2015-16. Both brought with them nasty 15-20% equity downturns, new lows in Treasury yields and forced central banks to become more accommodative.
The Fed has referred to its shift from rate-hiking last year to three cuts this year as a “mid-cycle adjustment,” which would leave it on hold for now and summons happy memories of prior such Fed-enabled “soft landings.”
‘Still upside’ for stocks
Jurrien Timmer, head of global macro at Fidelity, has been tracking the current market performance against previous mid-cycle “mini-bear markets” of the ’90s and 2011.
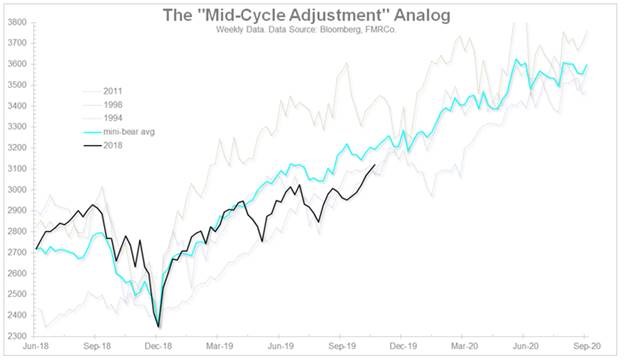
Source: Fidelity
Citing the recent upturn in global industrial surveys and central-bank pivots toward easier policy, Timmer says, “I’m not prepared to call it early cycle, but perhaps it’s a mini-reflation wave within an ongoing late cycle. Maybe the markets are whistling past the graveyard, but my sense is that this is the playbook right now.”
Citi’s Tobias Levkovich, says, “Our biggest concerns for the S&P 500 are more [second-half 2020] related, tied to the possibility of a business slowdown caused by management teams hunkering down prior to the elections, tighter [commercial] lending standards in October with a traditional nine-month lag, our margin lead indicator and the impact of the yield curve’s shape on volatility with a two-year lag… But in the interim there is still upside for equities even if such gains become more limited.”
Ned Davis Research, in its 2020 outlook, boils down four separate cycles — tied to the economy and earnings; Fed policy; the election-year cadence; and NDR’s own model of equity-market conditions and trend — to arrive at a year-ahead S&P target of 3225, up a few percent from here.
The fourth-quarter collapse in the S&P 500 last year amounted to a comprehensive flush for the market, pummeling the majority of stocks far worse than the indexes, resetting valuations to a five-year low and generating the highest investor-pessimism levels of this bull market. The reversal higher one year ago set off a rare “breadth thrust” signal of the sort more typically seen at the start of major market advances.
Now, the S&P is 34% higher with earnings just about flat and the trailing price/earnings multiple is near a cycle high above 20 and investor sentiment is far more optimistic. So perhaps the market is now priced for a glass-almost-full scenario rather than the end of a cycle. But if the market isn’t detecting signs of a recession, it tends to find a way to stay supported or work its way higher — even if fitfully, and shadowed by constant end-of-cycle warnings.
Courtesy of CNBC
Read More, Comment and Share......
Since the beginning of the Industrial Revolution, the world has seen its population and the need for natural resources boom.
As more people and wealth translate into the demand for global goods, the prices of commodities—such as energy, agriculture, livestock, and metals—have often followed in sync.
This cycle, which tends to coincide with extended periods of industrialization and modernization, helps in telling a story of human development.
Why are Commodity Prices Cyclical?
Commodity prices go through extended periods during which prices are well above or below their long-term price trend. There are two types of swings in commodity prices: upswings and downswings.
Many economists believe that the upswing phase in super cycles results from a lag between unexpected, persistent, and positive trends to support commodity demand with slow-moving supply, such as the building of a new mine or planting a new crop. Eventually, as adequate supply becomes available and demand growth slows, the cycle enters a downswing phase.
While individual commodity groups have their own price patterns, when charted together they form extended periods of price trends known as “Commodity Super Cycles” where there is a recognizable pattern across major commodity groups.
How can a Commodity Super Cycle be Identified?
Commodity super cycles are different from immediate supply disruptions; high or low prices persist over time.
In our above chart, we used data from the Bank of Canada, who leveraged a statistical technique called an asymmetric band pass filter. This is a calculation that can identify the patterns or frequencies of events in sets of data.
Economists at the Bank of Canada employed this technique using their Commodity Price Index (BCPI) to search for evidence of super cycles. This is an index of the spot or transaction prices in U.S. dollars of 26 commodities produced in Canada and sold to world markets.
- Energy: Coal, Oil, Natural Gas
- Metals and Minerals: Gold, Silver, Nickel, Copper, Aluminum, Zinc, Potash, Lead, Iron
- Forestry: Pulp, Lumber, Newsprint
- Agriculture: Potatoes, Cattle, Hogs, Wheat, Barley, Canola, Corn
- Fisheries: Finfish, Shellfish
Using the band pass filter and the BCPI data, the chart indicates that there are four distinct commodity price super cycles since 1899.
- 1899-1932:
The first cycle coincides with the industrialization of the United States in the late 19th century. - 1933-1961:
The second began with the onset of global rearmament before the Second World War in the 1930s. - 1962-1995:
The third began with the reindustrialization of Europe and Japan in the late 1950s and early 1960s. - 1996 – Present:
The fourth began in the mid to late 1990s with the rapid industrialization of China
What Causes Commodity Cycles?
The rapid industrialization and growth of a nation or region are the main drivers of these commodity super cycles.
From the rapid industrialization of America emerging as a world power at the beginning of the 20th century, to the ascent of China at the beginning of the 21st century, these historical periods of growth and industrialization drive new demand for commodities.
Because there is often a lag in supply coming online, prices have nowhere to go but above long-term trend lines. Then, prices cannot subside until supply is overshot, or growth slows down.
Is This the Beginning of a New Super Cycle?
The evidence suggests that human industrialization drives commodity prices into cycles. However, past growth was asymmetric around the world with different countries taking the lion’s share of commodities at different times.
With more and more parts of the world experiencing growth simultaneously, demand for commodities is not isolated to a few nations.
Confined to Earth, we could possibly be entering an era where commodities could perpetually be scarce and valuable, breaking the cycles and giving power to nations with the greatest access to resources.
Each commodity has its own story, but together, they show the arc of human development.
Courtesy of Infographic
Read More, Comment and Share......
 https://imageproxy.themaven.net/https%3A%2F%2Fs3-us-west-2.amazonaws.com%2Fmaven-user-photos%2Fmishtalk%2Feconomics%2FzmfATcSa4EegwR7v_znq6Q%2FInygtti8VkOkMC6cJ4kDng?w=962&q=30&h=581&auto=format&fit=crop&crop=focalpoint&fp-x=0.5&fp-y=0.5&fp-z=1&fp-debug=false 1.5x, https://imageproxy.themaven.net/https%3A%2F%2Fs3-us-west-2.amazonaws.com%2Fmaven-user-photos%2Fmishtalk%2Feconomics%2FzmfATcSa4EegwR7v_znq6Q%2FInygtti8VkOkMC6cJ4kDng?w=1282&q=20&h=774&auto=format&fit=crop&crop=focalpoint&fp-x=0.5&fp-y=0.5&fp-z=1&fp-debug=false 2x, https://imageproxy.themaven.net/https%3A%2F%2Fs3-us-west-2.amazonaws.com%2Fmaven-user-photos%2Fmishtalk%2Feconomics%2FzmfATcSa4EegwR7v_znq6Q%2FInygtti8VkOkMC6cJ4kDng?w=1923&q=10&h=1161&auto=format&fit=crop&crop=focalpoint&fp-x=0.5&fp-y=0.5&fp-z=1&fp-debug=false 3x " alt="" width="641" height="387" />
The economic outlook based on freight shipments is growing dim.Global expansion has peaked.
Please consider the Economic Outlook from Freight’s Perspective.
Cass' Growing Concerns
- When the December 2018 Cass Shipments Index was negative for the first time in 24 months, we dismissed the decline as reflective of a tough comparison. When January 2019 was also negative, we again made rationalizations. Then February was down -2.1% and we said, “While we are still not ready to turn completely negative in our outlook, we do think it is prudent to become more alert to each additional incoming data point on freight flow volume, and are more cautious today than we have been since we began predicting the recovery of the U.S. industrial economy and the rebirth of the U.S. consumer economy in the third quarter of 2016.”
- When March was down -1.0%, we warned that we were preparing to ‘change tack’ in our economic outlook.
- With April down -3.2%, we see material and growing downside risk to the economic outlook. We acknowledge that: all of these still relatively small negative percentages are against extremely tough comparisons; the two-year stacked increase was 6.6% for April; and the Cass Shipments Index has gone negative before without being followed by a negative GDP. We also submit that at a minimum, business expansion plans should be moderated or have contingency plans for economic contraction included.
- The initial Q1 ’19 GDP report of 3.2% suggests the economy is growing faster than is reflected in the Cass Shipments Index. Our devolvement of GDP explains why the apparent disconnect is not as significant as it first appears.
- The weakness in spot market pricing for many transportation services, especially trucking, is consistent with the negative Cass Shipments Index and, along with airfreight and railroad volume data, heightens our concerns about the economy and the risk of ongoing trade policy disputes.
European Airfreight vs Eurozone PMI
 https://imageproxy.themaven.net/https%3A%2F%2Fs3-us-west-2.amazonaws.com%2Fmaven-user-photos%2Fmishtalk%2Feconomics%2FzmfATcSa4EegwR7v_znq6Q%2Fbj7b9juYUUO4zGs5H-FeQw?w=1026&q=30&h=627&auto=format&fit=crop&crop=focalpoint&fp-x=0.5&fp-y=0.5&fp-z=1&fp-debug=false 1.5x, https://imageproxy.themaven.net/https%3A%2F%2Fs3-us-west-2.amazonaws.com%2Fmaven-user-photos%2Fmishtalk%2Feconomics%2FzmfATcSa4EegwR7v_znq6Q%2Fbj7b9juYUUO4zGs5H-FeQw?w=1368&q=20&h=837&auto=format&fit=crop&crop=focalpoint&fp-x=0.5&fp-y=0.5&fp-z=1&fp-debug=false 2x, https://imageproxy.themaven.net/https%3A%2F%2Fs3-us-west-2.amazonaws.com%2Fmaven-user-photos%2Fmishtalk%2Feconomics%2FzmfATcSa4EegwR7v_znq6Q%2Fbj7b9juYUUO4zGs5H-FeQw?w=2052&q=10&h=1255&auto=format&fit=crop&crop=focalpoint&fp-x=0.5&fp-y=0.5&fp-z=1&fp-debug=false 3x " alt="" width="684" height="418.2964118564742" />
European airfreight volumes were negative since March 2018, but only by a small singledigit margins (-1% to -3%), until November 2018. Unfortunately, since then, volumes have started to further deteriorate. Our European Airfreight Index was down -6.8% in February and -1.5% in March.
Asia Pacific Airfreight
 https://imageproxy.themaven.net/https%3A%2F%2Fs3-us-west-2.amazonaws.com%2Fmaven-user-photos%2Fmishtalk%2Feconomics%2FzmfATcSa4EegwR7v_znq6Q%2FS--0lxDrQk6BlnCoUWmOAg?w=963&q=30&h=569&auto=format&fit=crop&crop=focalpoint&fp-x=0.5&fp-y=0.5&fp-z=1&fp-debug=false 1.5x, https://imageproxy.themaven.net/https%3A%2F%2Fs3-us-west-2.amazonaws.com%2Fmaven-user-photos%2Fmishtalk%2Feconomics%2FzmfATcSa4EegwR7v_znq6Q%2FS--0lxDrQk6BlnCoUWmOAg?w=1284&q=20&h=758&auto=format&fit=crop&crop=focalpoint&fp-x=0.5&fp-y=0.5&fp-z=1&fp-debug=false 2x, https://imageproxy.themaven.net/https%3A%2F%2Fs3-us-west-2.amazonaws.com%2Fmaven-user-photos%2Fmishtalk%2Feconomics%2FzmfATcSa4EegwR7v_znq6Q%2FS--0lxDrQk6BlnCoUWmOAg?w=1926&q=10&h=1137&auto=format&fit=crop&crop=focalpoint&fp-x=0.5&fp-y=0.5&fp-z=1&fp-debug=false 3x " alt="" width="642" height="379" />
Asian airfreight volumes were essentially flat from June to October 2018, but have since deteriorated at an accelerating pace (November -3.5%, December -6.1%, January – 5.4%, February -13.3%, March -3.3%). If the overall volume wasn’t distressing enough, the volumes of the three largest airports (Hong Kong, Shanghai, and Incheon) are experiencing the highest rates of contraction.
Even more alarming, the inbound volumes for Shanghai have plummeted. This concerns us since it is the inbound shipment of high value/low density parts and pieces that are assembled into the high-value tech devices that are shipped to the rest of the world. Hence, in markets such as Shanghai, the inbound volumes predict the outbound volumes and the strength of the high-tech manufacturing economy.
Shanghai Airfreight
 https://imageproxy.themaven.net/https%3A%2F%2Fs3-us-west-2.amazonaws.com%2Fmaven-user-photos%2Fmishtalk%2Feconomics%2FzmfATcSa4EegwR7v_znq6Q%2FXU7w6NrMi0-VLTW-lQ3Arw?w=993&q=30&h=635&auto=format&fit=crop&crop=focalpoint&fp-x=0.5&fp-y=0.5&fp-z=1&fp-debug=false 1.5x, https://imageproxy.themaven.net/https%3A%2F%2Fs3-us-west-2.amazonaws.com%2Fmaven-user-photos%2Fmishtalk%2Feconomics%2FzmfATcSa4EegwR7v_znq6Q%2FXU7w6NrMi0-VLTW-lQ3Arw?w=1324&q=20&h=846&auto=format&fit=crop&crop=focalpoint&fp-x=0.5&fp-y=0.5&fp-z=1&fp-debug=false 2x, https://imageproxy.themaven.net/https%3A%2F%2Fs3-us-west-2.amazonaws.com%2Fmaven-user-photos%2Fmishtalk%2Feconomics%2FzmfATcSa4EegwR7v_znq6Q%2FXU7w6NrMi0-VLTW-lQ3Arw?w=1986&q=10&h=1269&auto=format&fit=crop&crop=focalpoint&fp-x=0.5&fp-y=0.5&fp-z=1&fp-debug=false 3x " alt="" width="662" height="423" />
The data underlying economic history is clear: the more unrestricted and robust global trade is, the more prosperous the global population becomes. Open markets of free trade are the greatest method to efficiently allocate resources and ensure that the best quality goods made by the most efficient producers are available to everyone. Unrestricted global trade lifts hundreds of millions, even billions, of the world’s population out of poverty. ‘Protectionism,’ like so many government regulations and programs, frequently produces results that are the exact opposite of the intended outcome.
Whether it is a result of contagion or trade disputes, there is growing evidence from freight flows that the economy is materially slowing. Our confidence in this outlook is emboldened by the knowledge that since the end of World War II (the period for which we have reliable data) there has never been an economic contraction without there first being a contraction in freight flows. Conversely, during the same period, there has never been an economic expansion without there first being an expansion in freight flows.
Welcome Views on Free Trade
It is extremely refreshing to see an article discussing free trade that gets a 100% Mish approval.
To the excellent Cass synopsis, it's important to add that when free trade stops, wars frequently start. Moreover, the result is never any good whether wars start or not.
The Great Depression is the classic example of the collapse in trade.
Although the Smoot-Hawley Tariff Act did not cause the "Great Depression" it did help turn a depression into the "Great Depression".
Prior to the Great Depression, the term recession did not exist. Thus, when you hear talk of the Fed saving the day preventing another depression, it's total nonsense.
All the recessions following the Great Depression would have been labeled depressions before 1929.
Global Recession
There is no official definition of a "global recession". Some define the term as under 2% growth. Others say under 3.0%. I am willing to split the difference.
The US recession may not have started yet, but a global recession (under 2.5% growth), likely has.
Courtesy of Mish
Read More, Comment and Share......
Ms. DiMartino Booth, why is the Federal Reserve bad for America?
Because of its intellectual dishonesty. The Fed noticed around 2009 that if they had had a more reliable and realistic inflation gauge on which to set policy, they would have seen the crisis coming. But despite that recognition, they chose to do nothing about it.
Are there more realistic inflation gauges?
Several Federal Reserve Districts have come up with alternative gauges. The underlying inflation gauge from the New York Fed for example also includes asset price inflation. And it runs about one percentage point higher than what the Fed measure is – they prefer the core Personal Consumption Expenditures Price Index, the core PCE.
How would monetary policy look like with a more realistic inflation gauge?
Monetary policy would be much different. The Fed would not have been able to maintain a monetary policy as easy as it has done over the last couple of years. Central bankers are hiding behind the core PCE being at 1,6%. They’re saying that this gives them cover to not normalize interest rates. But even the core Consumer Price Index has been north of 2% for 14 months.
What does this mean for current monetary policy?
Former Fed Chair Janet Yellen lead the slowest rate hiking campaign in the history of the Fed. Had she been using a more realistic inflation gauge, she would not have left current Chair Jay Powell with having to play catch-up. He wasn’t able to normalize interest rates, nor to run down the balance sheet as much as he would have been able to otherwise – and had Ben Bernanke not insisted on the 2% inflation target.
What is the reason behind the inflation target of 2%?
Alan Greenspan and Paul Volcker said that the best inflation rate as far as households and businesses are concerned is 0%. There is nothing that is damaging to a household about inflation being non-existent. As Greenspan and Volcker both pointed out: If you have 2% inflation steadily for 50 years, the value of the dollar in your wallet is diminished. Inflation is corrosive as a factor of time.
What about the risk of falling into deflation?
A deflation in wages, as we saw during the Great Depression, is the worst-case scenario. But Japan has served as a modern-day reminder that households are not going to be injured by very very low levels of inflation. In a disinflationary environment with a decent level of growth, you’re not running that risk. You’re still going to have job creation and economic growth. But you’re not going to have the pressure of rising prices on households. Housing makes up 33% of the average US household budget, and housing inflation has gone through the roof in recent years. Not that it’s captured correctly in the metric that the Fed uses.
So, why is the Fed aiming for 2%?
When Stanley Fisher was vice chair, he asked the same question during his first Federal Reserve meeting. He said, why do you insist on using this antiquated broken method? One of the staffers raised his hand and said if we didn’t use it, then the models would not work.
Why has the Fed become more dovish recently?
Credit market volatility picked up appreciably last year as we moved from 2,1 trillion $ of global Quantitative Easing for the full year 2017 to zero in December. This drained liquidity from the system on a global basis. In December, we had had no junk bond issuance in the US for a record period of 41 days. There were outflows from bond funds and spreads started to widen.
So the reason for the Fed being more dovish wasn’t the stock market?
Not as much as it has to do with how problematic and difficult it would be to address a seizing up in bond market liquidity with monetary policy, given that we have got nearly 250 trillion $ of debt worldwide. The fact that Powell completely changed his approach and started sounding like he was channeling a combination of Janet Yellen and ECB President Mario Draghi implies, that there’s not much the Fed can do to address a liquidity crisis.
How liquid is the bond market now?
Some weeks ago the issuance in the junk bond market dried up for an entire week. After that, Powell had his Draghi moment at the Chicago Fed conference, saying the Fed would do whatever it takes to sustain the economic expansion.
What do you expect at the Fed meeting on June 19th?
I expect the Fed to lower its expectations for economic growth and the labor market and prepare the financial markets for the possibility of a rate cut if conditions were to deteriorate. Powell will lay the groundwork for having as much flexibility as the Fed needs to cut rates. It’s quite clear that it is a global coordinated effort, given the communiques out of European Central Bank and the bank of Japan where we’re starting to hear about rate cuts from these two institutions.
What is the state of the US economy?
The US economy is definitely slowing. The CEO confidence is at the lowest level since the last quarter of 2016.
Is there a recession imminent?
It could just be a matter of either we are already in recession or it is coming very soon.
But stock markets trade near record highs.
The market is expecting the Fed to be very aggressive in launching a rate cut campaign. Powell and others have given speeches recently that appear to advocate negative interest rates, as is the case in Europe and in Japan, and also more Quantitative Easing. A lot of the optimism in stock markets is based upon investors’ perceptions that if the Fed pumps enough liquidity into the system, that will allow for stock markets to never correct.
So Powell will save the stock market.
That’s the reigning theory. Jay Powell will save the day. We have never seen an episode in US history when we technically are in a recession and when earnings decline quarter after quarter but we don’t see a negative impact in the stock market. But try telling that to the stock market.
How will monetary policy look like in a couple of years?
I have no idea. We are falling further down into the rabbit hole of unconventional monetary policy.
Is there any way to get out?
I don’t know. There is so much debt. They have created debt in order to resolve an over-indebtedness problem. So it’s the policy makers themselves that have made the situation that much worse. Think about insurance companies and public pension plans throughout Europe and Japan. How do you sustain yourself when interest rates are negative?
What can the Central Banks do?
There are no easy choices to be made. If you’re Draghi’s replacement, what do you do? Do you just say, okay let Italy go, it’s only the third largest sovereign debt market in the world. Central Bankers have made their choices much more difficult by insisting on never normalizing. It was well-known in the US in 2008 that there was a liquidity problem that was seizing the market, not the cost of credit. The Fed didn’t even have to go below 2% in 2008 because what was plaguing the financial system was a lack of liquidity. Those problems were resolved with the facilities that were created by the New York Fed. The problems were not resolved by taking interest rates to 0%. The price of money at times of financial market disruption is irrelevant.
Courtesy of Finanz and Wirtschaft
Read More, Comment and Share......
The US yield curve has (almost) inverted, and this has been making headlines for the last couple of months now. This should come as no surprise, as the yield curve is perhaps the most reliable recession indicator out there. But what does an inverted yield curve tell us about future returns? Our analysis shows that while asset class returns in general are somewhat subdued between the first date on which the yield curve inverts and the start of the recession, the inversion of the yield curve is not followed by extraordinary deviations in returns.

Definition
Before moving over to the results of our analysis, we would like to dwell briefly on the definition of the yield curve, and the combination of maturities in particular. In most empirical research, the yield curve is either defined by the differential between the 10-year and 3-month US Treasury yield (10Y-3M), or the 10-year and 2-year US Treasury yield (10Y-2Y). The reasons for preferring one over the other depends on many things, including data availability – the 3-month US Treasury yield has a much longer history; the degree to which you want to capture short-term versus long-term views on GDP growth and inflation, which is likely to be better reflected in the 2-year yield; and/or forecasting accuracy and timeliness, a point we will get back to later. As noticed by the New York Fed in its study ‘The Yield Curve as a Leading Indicator: Some Practical Issues (2006): “Spreads based on any of the rates mentioned are highly correlated with one another and may be used to predict recessions.” Hence, we will look at both the 10Y-3M and 10Y-2Y inverted yield curves, also because this leads to at least one interesting observation.
Inversions and recessions

As mentioned, the yield curve qualifies as one of the best, if not the best, recession forecasters. For the 10Y-2Y yield curve, we have reliable data covering the last five US recessions, all of which were accurately forecasted well in advance, as shown in the right panel in the table above. The lag between the first ‘inversion date’ and the start of the recession, as determined by the National Bureau of Economic Research (NBER), averages 21 months, ranging from 11 months until the 1981 recession to 34 months until the 2001 recession. The results for the 10Y-3M yield curve, as shown in the left panel in the table above, are highly comparable, with an average lead time of 19 months until the next recession. The data further reveals that prior to the last five recessions, the 10Y-2Y yield curve inverted before the 10M-3M yield curve on each occasion. From this angle, the 10Y-2Y yield curve should be the preferred recession indicator, as it ‘detects’ the next recession first.
The available data history for the 10Y-3M yield curve is longer, covering the last seven recessions. We find that the 10Y-3M yield curve correctly predicts these two additional recessions (1970, 1973) as well. However, it also seems to have given a false signal. On 12 January 1966, the 10Y-3M yield curve inverted for six days, but the next recession did not start until January 1970, or four years later. Obviously, the time horizon for which to assign forecasting power is arbitrary, but four years is considerably longer than in other cases. In addition, between early 1967 and December 1968, the 10Y-3M yield curve did not invert once, suggesting that we are looking at a separate period of yield curve inversion. Unfortunately, we can’t compare these inversions with the 10Y-2Y yield curve, due to a lack of data. Therefore, we will focus on the last five recessions, for which we have data on both the 10Y-3M and 10Y-2Y yield curve, for the remainder of this analysis.
Inversions and asset class returns

So, what does yield curve inversion tell us about (future) asset class returns? The table above shows the average and median annual returns on most major asset classes, US stocks, global stocks, commodities, gold, US Treasuries and US corporates, as well as US real GDP growth for both yield curves. The returns are calculated as the index change between the first negative reading of the yield curve leading up to a recession, and the first day of that same recession. In short, it calculates the performance between the inversion date and the start of the recession. The last row of the table shows the average annual return for the full sample period, from August 1978 until 1 January 2008. As can be derived from the table, this period was an exceptionally strong period for both stocks and bonds, with average annual returns above their longer-term history.
We will now summarize our main findings. First, while there are differences between the returns calculated using the 10Y-3M and 10Y-2Y yield curve, the results are highly comparable. Choosing either yield curve does not lead to different conclusions. Second, while variation in returns is substantial, they are far from extreme. For example, the average and median annual return on all asset classes is positive. No asset class shows severe and structural weakness after inversion, with only gold realizing a negative return in three out of the five inversion periods. But, as the table shows, gold returns are pretty erratic in any case. At the same time, none of the asset classes – again apart from gold – realized an extraordinarily high average return either. Having said that, for all asset classes the average annual return between yield curve inversion and recession was lower than for the full sample, except for commodities.
The deviation from the full sample average return is relatively large for US corporate bonds. For both yield curves, the average annual return after inversion was significantly below 3%, against a full sample return of 8.9%. This observation fits the perception that credits tend to struggle late cycle, as short-term interest rates are lifted by the Federal Reserve and leverage tends to rise. Global stock performance also trails between yield curve inversion and recessions: the average annual return is less than half than the full sample return. This can be explained by the defensive nature of US stock markets, and the fact that most other regions are highly dependent on the US economy, given their ‘openness’. It is a well-known maxim that when the US sneezes, the rest of the world catches a cold.
Lastly, with a 7% return, commodities are the only asset class which realized a much better return than the full sample average (2.8%) after yield curve inversion. This fits the characterization of commodities as ‘being late cycle.’ As final demand increases during economic expansion, so too does the demand for commodities. Hence, since raw materials are needed to produce goods now, the forward-looking aspect is likely to be of lesser importance than it is for equities and bonds.
A word on growth
Before moving over to the final part of this analysis, a quick word on growth. As is shown in the final column of the table above, average real GDP growth between yield curve inversion and the start of the recession is very close to, and even slightly above, the average of the full sample. This implies there is no such thing as a gradual cooling of the economy before slipping into recession. This helps explain why forecasting recessions is incredibly hard. Just ask the IMF, which has not been able to predict even half of the recessions just months before they started.
Has the yield curve inverted?

The yield curve, be it either the rate difference between the 10-year Treasury yield and the 3-month or 2-year yield, has a strong track record in predicting recessions. But has it inverted? Out of the last five recessions, the 10Y-2Y yield curve was always the first to signal a recession. This time, however, the 10Y-3M yield curve briefly inverted in late March, while the 10Y-2Y yield curve did not. While one should refrain from arguing that ‘this time is different’ as much as possible, the fact that the 10Y-3M curve inverted first makes this case different by definition. Quantitative easing followed by quantitative tightening (balance sheet reduction) could perhaps explain this divergent sequence, providing a potential argument why this yield curve inversion ‘doesn’t count’. But there were compelling reasons (a savings glut, structural budget surpluses) before to explain why yield curve inversions should not precede a recession. When looking at both yield curves and their forecasting history, it’s simply impossible to say if a recession signal has been given.
Still, as we believe it is possible to establish that we are in the later stages of the economic cycle, it could prove prudent to become somewhat less enthusiastic about the return prospects of corporate bonds (as reflected in our multi-asset portfolios) and be a bit more optimistic about those of commodities. To be continued…...
Courtesy of jeroenbloklandblog
Read More, Comment and Share......
Whether you're watching CNBC, Twitter or another news outlet, you're hearing a great deal of talk about the odds increasing that the Fed will drop rates soon. Everyone's cheering it on..........yet no one's talking about recession possibilities. Don't say 'recession' on live tv! Keep that notion out of your head! At least I believe that's what Trump is thinking as he warms up for his 2020 campaign. He wants the market "up, up, up". A strong stock market with plenty of green and profits in your pocket. If it fails after 2020, so be it. At least he'll have his re-election and be further away from any prosecutorial attacks for four more years. If he loses, blame it all on the Democrats!
In the meantime our yield curve continues to invert, or decay if you see it that way; implying a rough road ahead for the U.S. as China and European countries slowing low and behold, the U.S. having a "global market", the U.S. looks to be slowing as well. Shocker!
Now the US housing market is slowing and everybody should be aware of this. Then there's the Washington Post declaring “Wall Street Predicts Economy Slowing Dramatically.” The story says investment bank Goldman Sachs is predicting a second-half of 2019 slowdown due to the fading effects of federal tax cuts and rising federal interest rates.
So what do traders do? Of course they now believe Powell will "bail us out" once again and lower rates, rather than raise. Save us from the big slowdown! The big question now is, how low can he go? Now where near as low as they did after the financial crisis but will it be enough? They're now betting on a rate cut in September but at least one Pragmatist stands by his guns and hopes for a hike - bring it now. I wish he were right but this is a market under Trump. All normal bets are off.
Consider this: The U.S. is on average two years ahead of Europe in terms of economic rebound and growth. If we cut rates, they follow. If we hike, they will eventually follow suit........once the nasty Brexit turmoil is behind them, but it won't be this year. The U.S. should be leading. We should hike further and let equities suffer their correction. That would be a buying opportunity for all.
The 2020 election should have nothing to do with price discovery. Keep it separate and apart. Now we must consider, will Trump let us?
Read More, Comment and Share......
Maybe you've never heard of MMT (Modern Monetary Theory). But no doubt, as the 2020 election nears, you will. It's the latest contentious buzzword to hit Washington, D.C.
The idea, despite its name, is not new or "modern." But it has set off a heated political and economic debate, with Fed Chairman Jerome Powell telling Congress last week that Modern Monetary Policy is "just wrong."
Does Modern Monetary Theory, or MMT, represent a brave new future of ever-expanding government spending to meet Americans' vital needs? Or is it a dangerous idea that could lead to runaway inflation, financial disaster and, ultimately, collapse?
The theory, in a nutshell, says that because the U.S. can borrow in its own currency, it can simply print more money when it needs to pay off its debts. All the Fed has to do is keep interest rates low. Simple. It's an increasingly popular idea among left-leaning economists.
Fed Chairman Powell: MMT Is 'Just Wrong'
Not surprisingly, however, when Fed Chairman Powell testified before Congress on Tuesday, he pulled no punches on Modern Monetary Theory.
"The idea that deficits don't matter for countries that can borrow in their own currency I think is just wrong," Powell said, describing one of MMT's main pillars. "And to the extent that people are talking about using the Fed — our role is not to provide support for particular policies. Decisions about spending, and controlling spending and paying for it, are really for you (Congress.)"
Mainstream economists — even on the left — don't like the MMT idea.
For one thing, it violates a widely-held tenet of conventional monetary theory: That the quantity of money matters, especially for inflation. MMT maintains if inflation becomes a problem, just raise taxes. And print money to pay your bills.
Critics also note that MMT would support politicians issuing massive amounts of new debt backed by the printing press. Spending and debt would soar, crowding out private investment by sucking up private savings.
In response, leading proponents argue that those who oppose MMT don't really get how it works.
"The MMT framework rejects this, since government deficits are shown to be a source (not a use!) of private savings," writes Stephanie Kelton, a professor at Stony Brook and former economic advisor to Sen. Bernie Sanders' 2016 presidential campaign, in a recent Bloomberg piece. "Some careful studies show that crowding-out can occur, but that it tends to happen in countries where the government is not a currency issuer with its own central bank."
MMT Used To Justify Federal Spending
This is more than just another dorm-room debate with no consequences.
Democratic Party proposals like the Green New Deal, Medicare for All, and guaranteed incomes and jobs, will cost enormous sums. By at least one estimate, the 10-year tab for the progressive Democratic agenda now emerging from Congress could total $93 trillion. Only MMT, proponents say, could pay for it all.
This idea, in particular, angers MMT's foes.
"It is intellectually fraudulent, though I suspect Stephanie (Kelton) is a true believer," economist Dan Mitchell, co-founder of the free-market Center for Freedom and Prosperity, told IBD. "In any event, it is the fiscal/monetary equivalent of a perpetual motion machine. Sort of turbocharged Keynesianism."
Other economists note Modern Monetary Theory is a decades-old idea that's been debated, and discarded, by mainstream economists. MMT has only recently re-emerged as a way to justify more spending.
"The theory does ... lend itself to use, if not to abuse, by big spending proponents," said George Selgin, director of the Cato Institute's Center for Monetary and Financial Alternatives. "They like to harp on its observation that governments' right to create money gives them practically unlimited spending capacity. That claim is true, if not banal. But it's also misleading: Governments may be able to spend without limit; but outside of recessions they can't do so to any great extent without having to make their citizens ultimately foot the bill, either by paying higher taxes or by having to endure inflation.
"When politicians promise something for nothing, people should be wary," he added. "There's nothing to MMT that should make them any less so."
MMT: Inflation Threat?
Even Paul Krugman, himself a liberal-left economist, finds MMT lacking. "When people expect inflation, they become reluctant to hold cash, which drives prices up and means that the government has to print more money to extract a given amount of real resources, which means higher inflation, etc.," he wrote last month. "Do the math, and it becomes clear that any attempt to extract too much from seigniorage (printing money) — more than a few percent of GDP, probably — leads to an infinite upward spiral in inflation. In effect, the currency is destroyed."
The Congressional Budget Office now predicts $1 trillion annual federal deficits during the next decade. And the Treasury reports that total U.S. national debt now exceeds $22 trillion.
So a lot hangs on the key question posed by Modern Monetary Theory: Do federal deficits and debts matter at all? Supporters of MMT say not if the Fed holds rates below the growth of both GDP and debt. That would stabilize the debt-to-GDP ratio, and hold down inflation.
But others argue the inflation risks of MMT are huge. The Fed since 1990 has kept inflation at about 2% by targeting it. Its political independence gave it room to do so. Examples abound elsewhere of central banks running the printing presses to please politicians, resulting in hyperinflation and economic collapse — Venezuela, Zimbabwe and Argentina, for example.
Courtesy of IBD
Read More, Comment and Share......
