Courtesy of a16z
Read More, Comment and Share......
Courtesy of a16z
Read More, Comment and Share......
Individuals from less privileged backgrounds may face higher barriers to entry into prestigious positions, meaning only the most skilled advance and succeed.
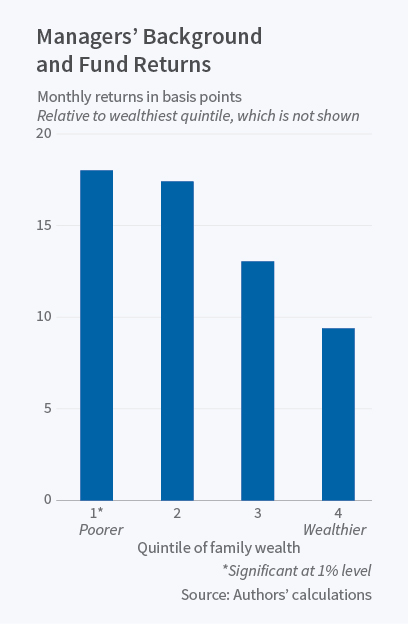
In Family Descent as a Signal of Managerial Quality: Evidence from Mutual Funds (NBER Working Paper No. 22517), Oleg Chuprinin and Denis Sosyura find that mutual fund managers from poor families consistently achieve better investment results than fund managers from wealthier backgrounds. The researchers also find significant differences in promotion patterns and trading styles between these two types of fund managers.
Previous studies about the relationship between managers' upbringing and their performance have focused on educational differences, including whether the managers attended elite universities or had access to education-related networks of influential people who could later help boost their careers. Such studies tend to find that managers with a stronger educational background tend to deliver better performance.
This study relies on hand-collected data from individual U.S. Census records on the wealth and income of managers' parents. The researchers also identified and verified fund managers via Morningstar, Nelson's Directory of Investment Managers, and LexisNexis Public Records. They ultimately identified hundreds of fund managers, most born in the mid-1940s, whose parents' Census records were in the public domain. They then examined the performance of hundreds of actively managed mutual funds focused on U.S. equities between the years 1975 and 2012.
The researchers find that mutual fund managers from wealthier backgrounds delivered "significantly weaker performance than managers descending from less wealthy families." Managers from families in the top quintile of wealth underperformed managers in the bottom quintile by over one percent per year on a risk-adjusted basis.
The researchers emphasize that these findings do not imply that those from poor families are in general better at their jobs than those with a more fortunate background. Rather, because individuals from less-privileged backgrounds have higher barriers to entry into prestigious positions, they argue, only the most skilled advance and succeed.
Indeed, in tracking career trajectories of mutual fund managers, they find that the promotions of managers from well-to-do families are less sensitive to their performance. In other words, managers who are born rich are more likely to be promoted for reasons unrelated to performance. In contrast, those born into poor families are fewer in number and are promoted only if they outperform. They also find that fund managers from less-affluent families who do make it into top ranks are more active on their job: they are more likely to trade and deviate from the market, whereas those born rich are more likely to follow benchmark indexes.
The researchers note that they chose to study mutual fund managers because they often work independently, and because funds' performance can easily be measured for comparison purposes. But they say their findings about family background and job performance may have implications that extend beyond asset management. "Our evidence suggests that an individual's social status at birth may serve as an important signal of quality in other industries with high barriers to entry, such as corporate management or professional services," they conclude.
Courtesy of NBER
Read More, Comment and Share......
So the year begins and with it a new presidency. Everyone has ideas how best to invest your money. Simple indexing is the least expensive way to manage capital; no, smart beta is superior; this year we are told (once again) will be when active stock-picking makes its triumphant return.
Regardless of how you choose to allocate your assets, there is another way; a much better way; a method that cannot fail in its brilliance and simplicity. Go with the POTUS indexes.
Direct your attention to the relentless tweeting of the man who soon will be president. There is valuable information in those 140 characters that can move markets and alter perceptions of corporate fundamentals. This has real alpha-generating possibilities. Whoever is managing your favorite 401(k), hedge fund or trading account should take note.
To help you make sense of this, we have created two indexes based on Donald Trump's tweet and other pre-presidential utterances.
Before we get to the specific stocks, I want to offer a bit more about the underlying concept. First it goes without saying that the U.S. president is the most powerful person on the planet. Although the U.S. Constitution places all sorts of constraints on his direct power, his every word is important, whether you agree with him or not.
Now consider the companies he has been tweeting or commenting about, both positively and negatively. You will recognize the two distinct groups that this creates, each with very different prospects.
In one group are companies that have drawn expressions of approval from Trump. An even greater endorsement is recruiting the senior executives of those companies to be cabinet members or advisers.
Let’s call this first group the Oligarch Index, or OLGY. (On your Bloomberg terminal, type .OLGY <Index> GP.) The Oligarch Index includes Colony Capital Inc., CoreCivic Inc., Exxon Mobil Corp., Facebook Inc., Ford Motor Co., Goldman Sachs Group Inc., JPMorgan Chase & Co., PayPal Holdings Inc., Sprint Corp., SoftBank Group Corp. and United Technologies Corp.
The other group is made up of those companies that Trump has trashed. We shall call this the Drain the Swamp Index, or SWMP. (On your Bloomberg terminal, type .SWMP <Index> GP.) This includes Amazon.Com Inc., Boeing Co., General Motors Co., Kellogg Co., Lockheed Martin Corp., Macy’s Inc., New York Times Co., PepsiCo Inc., Rexnord Corp., Tesla Motors Inc., Time Warner Inc., T-Mobile US Inc., Toyota Motor Corp. and Twitter Inc. and Constellation Brands Inc.
On the positive, oligarchic side, these are the companies that will help to make America great again:
• Colony Capital: Chairman Tom Barrack spoke at the Republican National Convention, and is chairman of Trump’s inauguration committee.
• Exxon Mobil: Chief Executive Officer Rex Tillerson, who has extensive global experience, is Trump's nominee to be secretary of State.
• Goldman Sachs: Alum Steve Mnuchin is Trump's pick for secretary of the Treasury and Gary Cohen, Goldman's president, is his pick to head the National Economic Council. Besides, how could we have an oligarch portfolio without Goldman?
• PayPal: Co-founder Peter Thiel was one of the few techies who had the foresight to back Trump early; he is also a director of Facebook, a major venue for passing around fake news.
• JPMorgan: CEO Jamie Dimon was recruited to be Treasury secretary. He convinced Trump that he could do more to help make America great again by continuing to run the nation's largest bank. A good guy and a great banker.
• United Technology: The company owns Carrier, which kept jobs in America. Thanks!
Now for some of the companies Trump disparaged, directly or otherwise:
• Amazon: Jeff Bezos, CEO, founder and largest shareholder of the online retailer, owns the Washington Post -- Trump’s least favorite paper.
• Boeing: Costs for building the new Air Force One are out of control -- cancel order!
• GM: It plans to make cars in Mexico? Make in U.S.A. or pay big border tax!
• Kellogg: It said that it would no longer advertise on conservative news website Breitbart. Boycott!
• Lockheed Martin: F-35s are a disaster -- price out comparable F18!
• Macy’s: The retailer dropped Trump’s clothing lines, and it had a disappointing holiday-sales season and plans to cut 10,000 jobs. Disloyal!
• New York Times: It, of course, is failing!
• Tesla: Global warming is a Chinese hoax.
• Time Warner: It owns CNN, which was so embarrassed by its total support of Hillary Clinton, and yet she lost in a landslide, that they don't know what to do.
• Twitter: It refused to create a “Lying Hillary” emoji; CEO Jack Dorsey was disinvited from Trump’s Tech Summit. Sad!
Rather than a stock-bond mix, think of this as a paired trade -- long OLGY, short SWMP. Can you imagine how much more significant and market-moving those tweets will be once Trump is sworn into office? This is theme investing at its finest. And as you can see from the chart below, you would have done quite well by investing on this basis:
This is going to make index investing great again.
Read More, Comment and Share......
Last year was a bad one for many companies selling expensive fashion, handbags, and jewelry. For the first time since the financial crisis of 2008, the global market for personal luxury goods failed to grow, stalling at €249 billion (about $258 billion). Will Trumps tax proposal send their sails soaring or will his proposed tariffs interfere?
The good news is that 2017 should see a return to growth, according to a Dec. 28 report on the global luxury market by management consulting firm Bain & Company, only it won’t look anything like the boom years from 2010 to 2015, when global sales of such goods jumped 45%, fueled by Chinese consumers with high-end appetites. The slowing of China’s economy and its government’s ongoing crackdown on corruption, paired with turmoil in the US and Europe from Brexit, terrorism, and the US presidential election, have created a “new normal” of low single-digit growth and intense competition. The years ahead will produce “clear winners and losers,” Bain says, determined by which brands can read the field and respond best.
China is at the center of this shift. Today Chinese shoppers account for 30% of all sales of personal luxury goods. While Bain foresees the Chinese market improving again after contracting slightly in 2016, it isn’t likely to return to its former rate of expansion, which insulated brands’ bottom lines from other problems. “We expect around 30 million new customers in the next five years coming from the Chinese middle class,” Claudia D’Arpizio, a Bain partner and lead luxury analyst, told Quartz in an interview last year. “But this is nothing comparable to the past big waves of demographics entering [the market]. This new normality will mean mainly trying to grow organically in the same consumer base, being more innovative with product, more innovative with communication.”
Exane BNP Paribas echoed the thought in a December research note to clients. “The peak of the largest nationality wave ever to benefit luxury goods is behind us,” the authors wrote. “Brands need a new paradigm, other than opening more stores in China and bumping up prices.”
The period luxury is entering could see some of its slowest growth since it started opening up to a mass audience around 1994. That was the year, D’Arpizio noted, that “the jeweler of kings and queens,” Cartier, launched its first lower-priced line for mainstream consumers. Other brands followed in search of greater sales, and names “like Gucci, Prada, also Bulgari were really growing, doubling size every year, sometimes triple-digit growth rates, opening up to 60 stores every year and covering all the capitals across the globe,” she said.

Around 2001 came another period of expansion when brands became global retailers, not just selling wholesale, amid a spate of acquisitions that would eventually create today’s giant luxury conglomerates, including LVMH and Kering (previously Gucci Group). By the time of the financial crisis, luxury had conquered much of the US, Europe, and Japan, and then China came along to offer more unfettered growth.
There’s no new China, however, at least not now. The next big luxury market is likely Africa, particularly countries such as Congo, Angola, and South Africa. But D’Arpizio estimated this scenario won’t come about for seven to 10 years, meaning only moderate expansion for some time.
“In the new normal, we expect a compound annual growth rate (CAGR) of 3% to 4% for the luxury goods market through 2020, to approximately €280 billion,” Bain’s report says. “That is significantly slower than the rapid expansion from the mid-1990s to the late 2000s.”
Other characteristics of this new period include more shoppers making purchases at home. Last year, local purchases exceeded tourist purchases by five percentage points, the first time since 2001 that has happened.
And digital sales will keep growing. Last year they accounted for 8% of the industry.
Courtesy of QZ
Read More, Comment and Share......

Amazon’s aerial dreams aren’t limited to drone deliveries.
In April, Amazon was awarded a patent (unearthed by a CB Insights analyst on Dec. 28 ) for Zeppelin-like warehouses in the skies. Amazon wants to create an “airborne fulfillment center” (AFC) to hover at altitudes of around 45,000 feet and spit out delivery drones with customers’ orders.
The designs suggest that the AFC will either be supported by an airship or incorporated into one. “An airship, or dirigible, is a type of aerostat or lighter-than-air aircraft which can navigate through the air under its own power,” the patent explains. “Airships gain their lift from gas that is less dense than the surrounding air, such as helium or hot air.” Not being fixed on the ground like conventional distribution centers has its perks: The AFC can change locations depending on factors likes weather and expected or actual demand.
Earlier this month, Amazon tested its first drone delivery in the United Kingdom, dropping off an Amazon Fire Stick streaming device and popcorn in 13 minutes. By having an autonomous mothership parked overhead a metropolitan area, it could get packages to customers “within minutes.” Delivery drones also won’t need to expend their battery lives on traveling long distances.
The patent outlines the scenario of a crowded sports games, where the flying warehouse could deliver snacks and sports memorabilia to fans. “This speed of delivery provides near instant gratification to users for item purchases and greatly increases the breadth of items that can be delivered,” the patent states. Temperature-controlled drones could make it easy to quickly deliver perishable items or prepared meals.
Once a delivery is complete, it’s not feasible for drones to climb back up 45,000 feet to re-enter the airborne warehouse. Instead, the drone will navigate to a replenishment shuttle, another smaller airship used to transport items to and from the AFC. The shuttle could replenish inventory, bring back delivery drones, carry fuel and more. Amazon foresees them transporting human workers as well.
Having a patent doesn’t mean the idea will ever be realized. And even if Amazon were to execute its vision, a drone-deploying aircraft is not likely to debut in the US anytime soon. It would violate a number of Federal Aviation Authority guidelines for commercial drones—for starters, they can’t fly over people or be launched from planes in the air.
Courtesy of QZ
Read More, Comment and Share......

Targeting companies or entire nations on Twitter is an unprecedented and controversial method of communication for a President-elect – but one can’t argue with its effectiveness so far.
In today’s chart, we take a look at Donald Trump’s rather unconventional form of “monetary policy”, and how it has potentially influenced the U.S. dollar and five other major currencies since his election in November.
A preview of President-elect Trump’s “America First” directive can already be seen on Twitter.
Trump’s infamous account, which is followed by 18.8 million people, is being used every day to highlight the potential winners and losers of future policies.
And markets are listening.
| Currency | % Change (vs. USD) |
|---|---|
| Russian Ruble | 7.7% |
| Canadian Dollar | 0.4% |
| Chinese Yuan | -1.5% |
| Euro | -5.0% |
| Mexican Peso | -13.4% |
The above table shows change in the value of foreign currencies against the U.S. dollar between November 7th, 2016 and today. To be fair, it is worth noting that oil prices have also rallied over this time, and oil also has a pronounced effect on some currencies.
Central to “America First” is a Trump-branded form of protectionism, which aims to keep jobs and dollars in the U.S at all costs. The President-elect has repeatedly blasted China for currency manipulation, as well as automotive companies which seek to produce cars in Mexico.
General Motors is sending Mexican made model of Chevy Cruze to U.S. car dealers-tax free across border. Make in U.S.A.or pay big border tax!
— Donald J. Trump (@realDonaldTrump) January 3, 2017
China, as one of the world’s major economic powers, has some leeway in any war of words with Trump. While the country sends 18% of its exports to the United States, it could also theoretically benefit economically with the U.S. taking a step back from foreign entanglements. China also holds $1.12 trillion of U.S. treasuries, which gives it some additional leverage.
On the other hand, Mexico has a lot more to worry about. The country sends 80.3% of its exports north of the border and could conceivably lose significant amounts of business if NAFTA is scrapped and tariffs are re-introduced. As a result, even with oil’s gains over the last two months, the peso has dropped -13.4% in value since Trump’s election in November.
On the opposite side of the spectrum, Trump has been making moves to warm up relations with Russia – a protectionist country that isn’t really a “threat” to U.S. jobs.
Great move on delay (by V. Putin) - I always knew he was very smart!
— Donald J. Trump (@realDonaldTrump) December 30, 2016
Russia, which has been on Trump’s “good side” so far, has had its ruble trade 7.7% higher since the election. These gains partially reflect the future easing of sanctions that were put in place after Moscow’s aggression toward Ukraine in 2014.
Read More, Comment and Share......
Before I present the insight on expected earnings ahead, there is one point I wish to make; that being Trump. If you're not following our President elect on Twitter, you should get with it now. Some may say it's not "Presidential" to be on TWTR but our commander and chief does what he wishes, and he wishes to scare whomever he can. At the very least, throw him up as a column on TweetDeck and watch the charts fly when he mentions a name.
Now while AMZN and GM were formerly expecting good growth in 2017, you will notice that both are now on Trumps radar for taxation and import/export fees which explains their recent trading action. There seems to be no love lost between AMZN owner Jeff Bezos. Even Trumps comments on taxation such as “If @amazon ever had to pay fair taxes, its stock would crash and it would crumble like a paper bag." should leave investors more than a tad concerned. At this point, I feel we'll see quite a bit of this concern over China/Mexico/taxation/tariffs in the next few months but in the meantime, there's always the Trump trades to rely on. Read on:
At the start of 2016, analysts were projecting earnings growth of 5.3% and revenue growth of 4.4% for the year. For the first half of 2016, the index reported declines in earnings and revenues. For the second half of 2016, the index is expected to report growth in earnings and revenues. Overall for the entire year, analysts believe the index will report slight growth in both earnings and revenues.
Here, we look at the expected earnings and revenue growth rate for the S&P 500 for 2016, with a focus on the top and bottom performing sectors, industries and companies for the year. 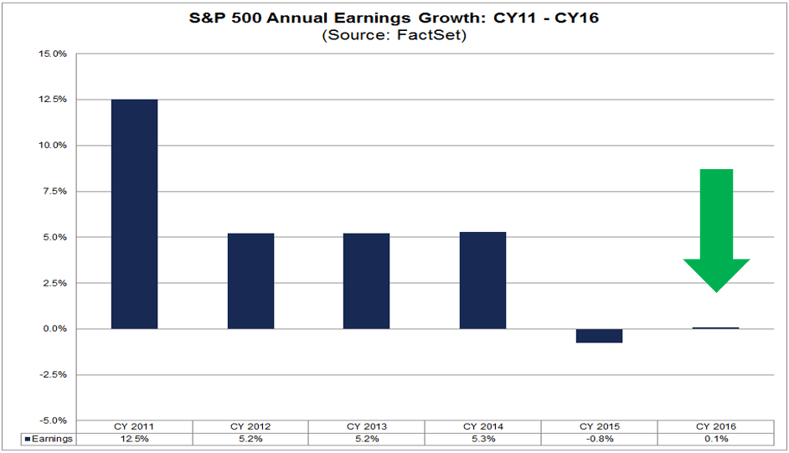
The estimated earnings growth rate for CY 2016 is 0.1%. Seven sectors are projected to report year-over-year growth in earnings, led by the Real Estate, Consumer Discretionary, and Utilities sectors. Four sectors are projected to report a year-over-year decline in earnings, led by the Energy sector.
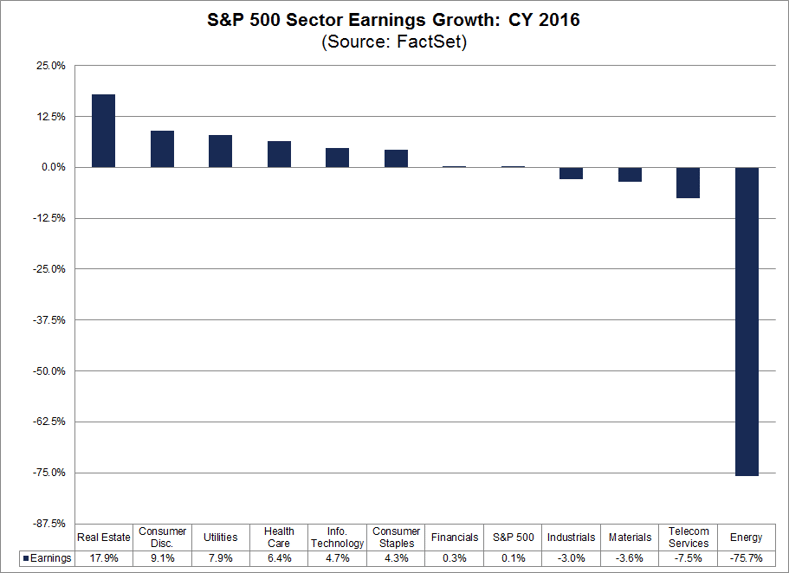
The Real Estate sector is expected to report the highest earnings growth rate of all eleven sectors at 17.9%. At the sub-industry level, five of the eight sub-industries in this sector are projected to report earnings growth for the year, led by the Health Care REITs (223%) and Residential REITs (111%) sub-industries. At the company level, Equity Residential and HCP are the largest contributors to earnings growth for this sector. The EPS growth for Equity Residential is benefitting from an unusually high EPS estimate for CY 2016, while the EPS growth for HCP is benefitting from a comparison to an unusually low EPS actual for CY 2015. The mean EPS estimate for CY 2016 for Equity Residential is $10.87, compared to year-ago EPS of $2.36. The mean EPS estimate for HCP for CY 2016 is $1.30, compared to year-ago EPS of -$1.21. If these two companies are excluded, the estimated earnings growth rate for the Real Estate sector would fall to -8.6% from 17.9%.
The Consumer Discretionary sector is projected to report the second highest earnings growth rate of all eleven sectors at 9.1%. At the industry level, eleven of the twelve industries in this sector are predicted to report earnings growth for the year. Of these eleven industries, four are projected to report earnings growth of more than 10%, led by the Internet & Direct Marketing Retail (49%) and Household Durables (27%) industries. At the company level, Amazon.com, General Motors, and Charter Communications are the largest contributors to earnings growth for the sector. The mean EPS estimate for CY 2016 for Amazon.com is $4.84, compared to year-ago EPS of $1.25. The mean EPS estimate for General Motors for CY 2016 is $6.02, compared to year-ago EPS of $5.02. The mean EPS estimate for Charter Communications for CY 2016 is $3.68, compared to year-ago EPS of -$2.69. If these three companies are excluded, the estimated earnings growth rate for the Consumer Discretionary sector would fall to 5.6% from 9.1%.
The Utilities sector is predicted to report the third highest earnings growth rate of all eleven sectors at 7.9%. At the industry level, all four industries in this sector are expected to report earnings growth for the year, led by the Independent Power & Renewable Electricity Producers (101%) industry. At the company level, 22 of the 28 companies in the sector (79%) are expected to report EPS growth for CY 2016. NRG Energy is the largest contributor to earnings growth in the sector. The mean EPS estimate for NRG Energy is for CY 2016 is $1.05, compared to year-ago EPS of -$0.48. If NRG Energy is excluded, the estimated earnings growth rate for the Utilities sector would fall to 5.8% from 7.9%.
The Energy sector is predicted to report the largest year-over-year decline in earnings of all eleven sectors at -75.7%. Five of the six sub-industries in this sector are expected to report a year-over-year drop in earnings: Oil & Gas Exploration & Production (N/A), Oil & Gas Equipment & Services (-92%), Oil & Gas Drilling (-82%), Oil & Gas Refining & Marketing (-61%), Integrated Oil & Gas (-49%). The only sub-industry expected to report growth in earnings for CY 2016 is the Oil & Gas Storage & Transportation (2%).
The Telecom Services sector is expected to report the second largest (year-over-year) earnings decline of all eleven sectors at -7.5%. Overall, four of the five companies in the sector (80%) are projected to report a decrease in EPS for the year. The one company that is driving the earnings decline for this sector is Level 3 Communications. However, the EPS decrease for this company is exacerbated by a comparison to unusually high earnings in CY 2015, due to unusually high EPS reported in Q4 2015. In the company’s earnings release from Q4 2015, Level 3 Communications stated (regarding EPS for the quarter), “This includes a non-cash benefit to the fourth quarter Income Tax Expense of approximately $3.3 billion related to the release of the company’s valuation allowance against U.S. federal and state deferred tax assets…” The mean EPS estimate for Level 3 Communications for CY 2016 is $1.59, compared to year-ago EPS of $9.58. If this company is excluded, the estimated earnings decline for the Telecom Services sector would drop to -0.1% from -7.5%.
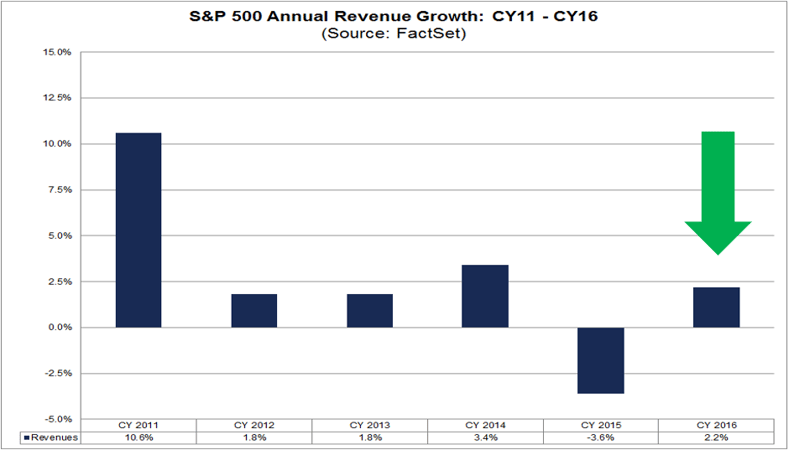
The estimated revenue growth rate for CY 2016 is 2.2%. Nine sectors are expected to report year-over-year growth in revenues, led by the Health Care, Consumer Discretionary, and Real Estate sectors. Two sectors are expected to report a year-over-year decline in revenues, led by the Energy sector.
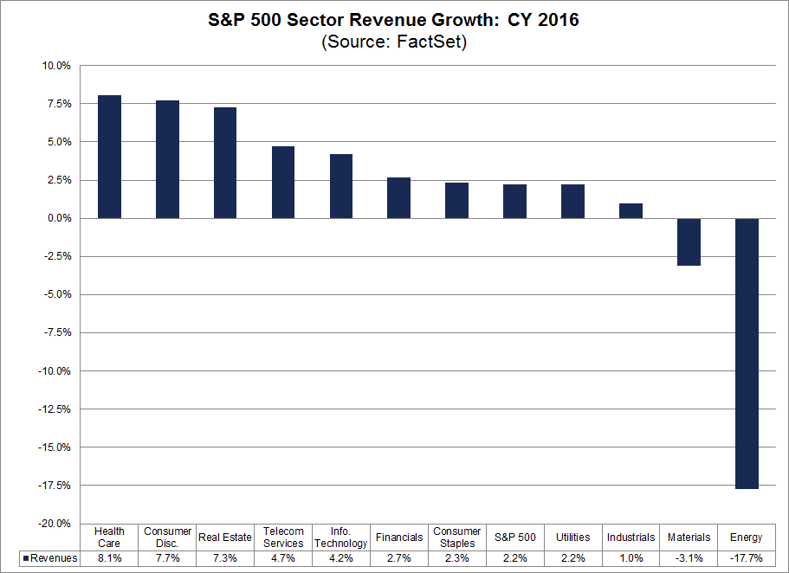
The Health Care sector is projected to report the highest revenue growth of all eleven sectors for CY 2016 at 8.1%. All six industries in this sector are expected to report sales growth for the year: Health Care Providers & Services (9%), Health Care Technology (9%), Life Sciences Tools & Services (6%), Biotechnology (6%), Pharmaceuticals (5%), and Health Care Equipment & Supplies (5%).
The Consumer Discretionary sector is projected to report the second highest revenue growth rate of all eleven sectors for CY 2016 at 7.7%. At the industry level, ten of the twelve industries in this sector are predicted to report sales growth for the year. Of these ten industries, three are projected to report revenue growth of more than 10%: Internet & Direct Marketing Retail (27%), Household Durables (17%), and Media (13%).
The Real Estate sector is expected to report the third highest revenue growth rate of all eleven sectors at 7.3%. At the sub-industry level, seven of the eight sub-industries in this sector are projected to report sales growth for the year, led by the Real Estate Services (21%), Industrial REITs (13%) and Specialized REITs (11%) sub-industries.
On the other hand, the Energy sector is expected to report the largest year-over-year decrease in sales of all eleven sectors for CY 2016 at -17.7%. All six sub-industries in the sector are predicted to report a decrease in revenues: Oil & Gas Drilling (-43%), Oil & Gas Equipment & Services (-31%), Oil & Gas Exploration & Production (-21%), Integrated Oil & Gas (-16%), Oil & Gas Refining & Marketing (-15%), and Oil & Gas Storage & Transportation (-2%).
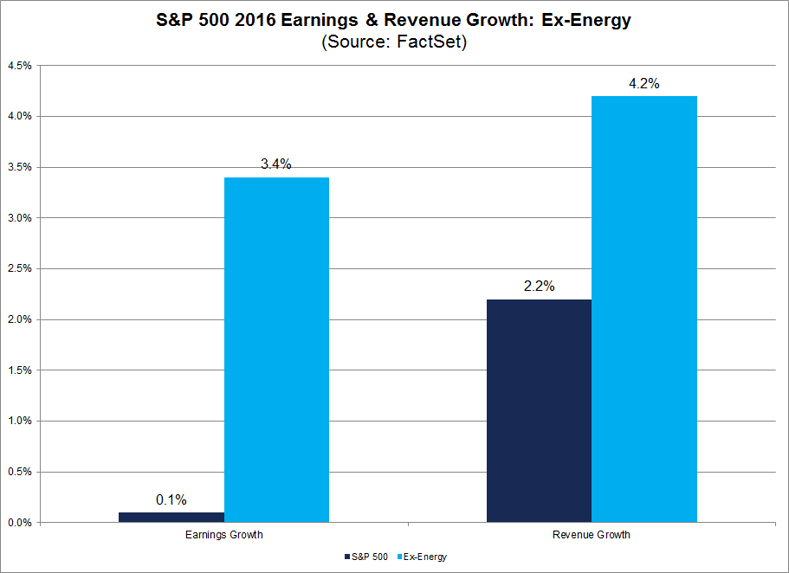
Not only is the Energy sector expected to report the largest year-over-year declines in earnings and revenues for 2016, it also is the largest detractor to the estimated earnings and revenue growth rates for the S& P 500 for 2016. If the Energy sector is excluded, the estimated earnings growth rate for the S&P 500 would jump to 3.4% from 0.1%, and the estimated revenue growth rate for the S&P 500 would jump to 4.2% from 2.2%.
Courtesy of FactSet
Read More, Comment and Share......
Read More, Comment and Share......

The Chart of the Week is a weekly Visual Capitalist feature on Fridays.
What has more value: all major publicly traded department stores in the United States, or Amazon?
Amazon takes the cake, and its no contest.
Add together the market caps of Walmart, Target, Best Buy, Nordstrom, Kohl’s, JCPenney, Sears, and Macy’s, it amounts to a significant $297.8 billion:
| Brick & Mortar Store | 2016 Value ($B) |
|---|---|
| Total | $297.8 |
| Sears | $1.1 |
| JCPenney | $2.6 |
| Nordstrom | $8.3 |
| Kohl's | $8.8 |
| Macy's | $11.0 |
| Best Buy | $13.2 |
| Target | $40.6 |
| Walmart | $212.4 |
However, it’s not enough to beat Amazon.
The online retailer alone is worth $356 billion, making it one of the largest companies by market capitalization in the world.
Ten years ago, the future of brick and mortar retail sill looked bright. The aforementioned retailers were worth a collective $400 billion, and Amazon was only valued at $17.5 billion.
But disruption often comes without warning. Or if there were warning signs, they went unheeded by retailers.
Big box and department store sales plummeted, as consumers increasingly went online to do their shopping. This year, it is estimated that revenues are equal to just 62% of their totals in 2006:
Big Box and Department Store Sales ($ Billion)

Retailers without the right strategy saw their market caps plummet.
Sears went from being worth $27.8 billion to $1.1 billion (a 96% decrease), while JCPenney went from $18.1 billion to $2.6 billion (a 86% decrease).
Here’s the full damage over the last 10 years to brick and mortar stores:
| Store | 2006 Value ($B) | 2016 Value ($B) | % Change |
|---|---|---|---|
| Total | $400.4 | $297.8 | -26% |
| Sears | $27.8 | $1.1 | -96% |
| JCPenney | $18.1 | $2.6 | -86% |
| Nordstrom | $12.4 | $8.3 | -33% |
| Kohl's | $24.2 | $8.8 | -64% |
| Macy's | $24.2 | $11.0 | -55% |
| Best Buy | $28.4 | $13.2 | -54% |
| Target | $51.3 | $40.6 | -21% |
| Walmart | $214.0 | $212.4 | -1% |
Amazon, on the other hand, did okay for itself.
The online retailer gained 1,934% in value over the same time frame, making it one of the most valuable companies in the world, and a key piece of Jeff Bezos’ business empire.
Courtesy of VisualCapitalist
Read More, Comment and Share......

The image was startling, but a look into what could be tech's immediate future.
After being ostracized by the tech industry for most of the election year, there sat venture capitalist Peter Thiel, beaming, to the left of President-elect Donald Trump at the Trump Tower Tech summit in mid-December.
Around him was a ring of glum-faced and pensive tech titans, including Apple's Tim Cook, Amazon's Jeff Bezos, Alphabet CEO Larry Page and Facebook COO Sheryl Sandberg.
Silicon Valley's billionaire leaders had disavowed Trump during the campaign, throwing their weight behind rival Hillary Clinton. Only Thiel stumped for the real-estate mogul, and after the tech industry had turned on him for that and his role in Gawker's failure, he was luxuriating in the I-told-you-so moment.
The display of power portends a roiling year or two in tech. Trump railed against Amazon and Apple in tweets about corporate taxes and cyber security; now, he's likely to shape those issues as well as immigration reform, job creation, trade with China, deregulation and more, as he vowed during a bruising campaign.
"Tech is unusual in that the industry does not depend on government regulation or transfer payments, the way that banking, pharma, defense, agriculture and energy do," says Roger McNamee, founding partner of venture-capital firm Elevation Partners. "All tech needs is policy stability and access to global markets. Trump prides himself on being unpredictable."
The stunning development offered a fitting cap to what was a topsy-turvy year for tech, which generated $3.5 trillion in domestic economic output and accounted for more than 15 million people, or 8.4% of total U.S. employment, according to the Computer Technology Association.
In the year that was, there were winners and losers among companies and technologies; new faces emerged while others faded; and driverless cars and drones became more visible in our streets and sky.
Apple's revenue and iPhone sales subsided while Snapchat threatened established Internet leaders on its way to what is likely to be a blockbuster IPO. Yahoo seemed to nail down a protracted sale of itself, while Twitter's struggles made it a persistent source of takeover speculation. In the background, tech's legacy companies entered into a series of cloud and data deals aimed at growth and relevancy.
Uber expanded its growing empire into self-driving cars — not without a trademark dust-up with government authorities — and Amazon soared with drones and our spending habits.
But there were growing problems for Facebook, grappling with a fake news fiasco that turned away some users, and at some of the many units at sprawling Google-owner Alphabet, from Nest to Fiber.
Perhaps no subject loomed over tech — and perhaps the world — than cyber security.
Whether computer breaches that compromised the personal information of millions of consumers to a targeted hack by Russian operatives that conceivably tilted the U.S. presidential election, the very nature of conflict transformed this year, says McNamee.
And with the advent of the Internet of Things, the battlefield could extend to our homes, warn security experts. In October, malicious software that lets hackers take over home devices like DVRs helped cause a massive Internet outage along the East Coast.
"One of the biggest trends is the world waking up and realizing that connected IoT devices need security," says Talal Shamoon, CEO of computer security company Intertrust.
Samsung's stumble with the self-igniting Galaxy Note 7 was an epic meltdown of quality control, distribution and marketing. Though it didn't dislodge the South Korean electronics giant as the pre-eminent smartphone seller globally, it undercut customer trust and raised questions on how the company will bounce back.
Speaking of hacks and meltdowns, Yahoo disclosed it had been the victim of two mega-hacks that compromised more than 1.5 billion accounts and put its $4.8 billion deal with Verizon in jeopardy.
Amid grousing from Verizon General Counsel Craig Silliman, who said breaches could "impact" the value of Yahoo, Yahoo’s reputation is likely to take a big hit, says Nir Kossovsky, CEO of Steel City Re, which insures companies against the financial impact of breaches and other damaging disclosures.
The hit TV show Westworld, about a futuristic park run by robotic "hosts," foresaw a society increasingly intertwined, and dependent, on artificial intelligence, bots and automation. Sound familiar?
Artificial intelligence is officially a craze — Facebook, Apple, Google and Microsoft are among those with aggressive plans. Virtual reality became more of a reality.
Drones are popping up in all shapes and sizes — 7-Eleven has been regularly delivering goods to consumers in Reno. Amazon, meanwhile, made its first drone delivery in the United Kingdom this month and Google X delivered burritos at Virginia Tech in September.
Self-driving cars took to the streets in Michigan, Pennsylvania, Arizona and California. Fully autonomous cars won’t be available for a few years, but a Morgan Stanley study estimates they will lead to productivity gains of $507 billion annually as consumers spend less time commuting and more time in meetings, writing reports and other business tasks.
Bots were ubiquitous, especially in the spread of fake news.
"Autonomous technology and AI became mainstream in 2016 with self-driving Teslas and new virtual assistants like the Amazon Echo," says Matthew Howard, managing partner at Norwest Venture Partners. "While we now have a clearer picture of where this technology is headed, we’re still only in the first inning (for the second coming of) AI."
There was nothing fake, however, over fears on what AI and increased automation will do to the workforce. This is sure to draw the attention of Trump, who lambasted Apple for exporting jobs overseas and discussed jobs creation in the two-hour tech summit this month.
Automation will have a profound impact on jobs across all Fortune 500 companies — not just Silicon Valley, says Box CEO Aaron Levie. "Tech is at the bleeding edge of the sphere on so many issues," he says. "It will be extremely interesting to see" how Trump's roundtable shakes out.
Speaking of the 45th president, his focus on immigration reform will undoubtedly pinch H-1B visas and heighten the urgency for increased STEM education, which was discussed at December's summit. What is unclear is how it might play into tech's stuttering attempts to become less homogenous by hiring more of the women and minorities who buy its products but have little role in their design.
There are 500,000 computing jobs open in the U.S., with an expected 20% growth rate over the next decade — yet only 55,000 bachelor degrees in computer science were doled out in 2014, according to Code.org and the Bureau of Labor Statistics.
"It's more important than ever," says Dennis Yang, CEO of Udemy, an online learning marketplace with more than 14 million students in 190 countries. "Independent of what the administration does, let's be real: Jobs increasingly will be adversely affected by automation. Tech will create jobs, but they will be super high-end, most likely for the building and programming of robots."
Tech's impasse with the Trump administration over job creation seems inevitable, but there may be hope. In his meeting with the reluctant CEOs, Trump vowed to keep the channels of communication open and meet quarterly.
2017 and beyond will tell.
Courtesy of USAToday
Read More, Comment and Share......
 We are into the homestretch of 2016, and the markets have seen strong upside this year, benefiting from the domestic economy's resilience and the election of Donald Trump.
With just four sessions to go, the Dow Jones Industrial Average has been a up a solid 14.4 percent, the S&P 500 has risen 10.8 percent and the NASDAQ Composite is 9.1 percent higher — with all the three major averages trading off their all-time closing highs.
Among the ten S&P sectors, eight have been in the green. Old economy stocks such as energy, material, industrial, financial, utility and telecom are all up by double-digit percentages. Technology stocks are also up decently. However, the healthcare sector has taken a hit.
Though it is tough to replicate the performance of 2016, given the tougher comparisons and the uncertainty around policies amid the political leadership transition, Wall Street does see some opportunities that are compelling.
Here is a compilation of some top picks recommended by Wall Street analyst for the year 2017:
Large-Cap Picks:
Small-Cap Pick:
The firm believes higher Fed rates in 2017 will boost net interest margin and earnings per share, although the same is expected to hit tangible book value/capital and may reduce buybacks.
Deutsche Bank's Carlo Santarelli is favorably biased toward regional operators heading into 2017, given favorable macro-economic indicators and the potential for policy-related boosts to the regional gaming consumer.
Large-Cap Picks:
Mid- And Small-Cap Picks:
Courtesy of Benzinga
Read More, Comment and Share......
In the most recent Summary of Economic Projections, Fed officials penciled in three 25bp rate hikes for 2017. The reality, however, could be very different. We all remember how “four” became “one” in 2016. The median dots are neither a promise nor an official forecast. As 2016 progressed, forecasts associated with a lower path of SEP “dots” evolved as the consensus view of policymakers. Will the same happen this year? I don’t think so; it is hard to see the Fed on pause for another twelve months.
As a starting point, I think it best to assume the US economy is near full-employment. But the US economy was near full-employment at this time last year as well. I think the key difference between then and now is that then the after-effect of the oil price slide and dollar surge placed a drag on the US economy sufficient to ease hiring pressure. At the same time, labor force participation perked up, setting the stage for a flat unemployment rate for most of the year. Inflationary pressures eased as well; the January inflation pop proved to be short-lived:
In effect, the US economy settled into a nice little equilibrium in 2016 that obviated the need for additional rate hikes. To expect a repeat scenario in 2017, one would need to assume that the US economy does not pick up speed and threaten that equilibrium by pushing past full employment.
Evidence, however, piles up suggesting that the slowdown of the past year is drawing to a close. ISM manufacturing and nonmanufacturing surveys are stronger, temporary help employment is heading up again, new manufacturing orders for nondefence, nonair capital goods have flattened out, and the broader inventory overhang is easing:
All of this occurs in the context of an unemployment rate that suddenly dipped toward the lower end of the Fed’s estimates of the natural rate of unemployment. And if the demographic forces reassert themselves, there is likely to be further downward pressure on the unemployment rate – job growth is well above estimates necessary to hold unemployment constant.
But would a total of 75bp of hikes be necessary to hold inflation in check? That depends in part the sensitivity of inflation to greater resource utilization. Greg Ip of the Wall Street Journal noted last week:
Unlike in 2009, this fiscal stimulus will be hitting when the economy is close to full employment with far less spare capacity. Yet it’s premature to assume inflation will therefore jump. In the last decade inflation, excluding swings due to energy, has proven surprisingly inertial, barely moving in response to high unemployment. The same is likely true if unemployment drops further below its “natural” level.
It is true that inflation is fairly inertial, although some policymakers will dismiss the lack of response to high unemployment as a consequence of downward nominal wage rigidity. Moreover, others will claim the reason for inertial inflation is that the Fed has properly responds to weak or strong economic conditions to hold inflation and, importantly, inflation expectations, in check. In other words, you won’t see inflation if the Fed acts preemptively.
Still, the broader point remains true that while further declines in unemployment will pressure the Fed to hiking rates more aggressively, low inflation like seen in November will temper that response.
In addition, policy going forward depends on the relative tightness of financial markets in general, and the dollar in particular. And the dollar has been on a tear in recent weeks:
The dollar serves as a break on the US economy. If activity expands as I anticipate, and the economy is near full employment as I believe, then some demand will be offshored as the rising dollar prompts the trade deficit to widen. Consequently, the Fed needs to be wary of feedback effects from the dollar as they tighten policy.
Bottom Line: The economic situation on the ground is very different from December of last year. Whereas the decision to raise rates at that time looked ill-advised, this latest action appears more appropriate given the likely medium-term path of the US economy. Assuming the US economy is near full employment, that path likely contains enough upward pressure on activity to justify more than one more rate increase in 2017. Three I think is more likely than one. That said, the change in administrations and the path of fiscal policy creates uncertainties in both directions.
Courtesy of EconomistsView
Read More, Comment and Share......

"A lie told often enough becomes the truth" - Vladimir Lenin
Imagine for a minute you lived centuries ago when people believed the earth was flat, or the earth revolved around the sun, or that planets were Gods, or that disease was angry spirits or supernatural powers. You'd have an explanation for everything ... only it would be wrong. And that "wrongness" would stand in the way of true understanding and true progress until they were discarded as falsehoods.
And so it is with the Stock Market. Let me explain.
First, let me be perfectly clear. I'm a statistician so I'm not referring to philosophical or political or gut feelings or anything other than Statistical Misrepresentations. Fact, not opinion.
I can hardly go a day without reading an article or hearing a TV pundit or someone regurgitate misconceptions that are so integrated in our minds ... we believe them to be the truth.
These misconceptions cause us to make investing mistakes because we take them as axiomatic when they are fantasy.
I am constantly amazed how often misconceptions about really fundamental aspects of the market persist. Not just amongst lay investors, but pundits and professionals as well. It just seems, at times, that investors WANT to be misled. I guess it gives them some sort of comfort ... even if it is wrong.
So, let's see if we can correct some of these misconceptions.
Let me take the most prevalent ones one at a time.
Average Market Returns:
I have to admit, I came across three articles today that made projections based upon Stock Market Average Returns. They all quote some historic average return over some historic period. In one particular article, the last 10 years was presented as an Average Annual Return of 9.05%.
The Stock Market Average Return is a meaningless metric. And here's why.
Average returns are relevant only if they are independent of each other. An example would help.
Let's say the market went up 15%, then down 15%, then up 15%, then down 15%. The average return is ZERO. But, let's do some math.
Start at $1,000.
1) In year one, the 15% goes to $1,150.
2) In year two, when it goes down 15%, it's down $173 to $977.
3) In year three, when it rises 15%, it goes up $147 to $1,124.
4) In year four, the 15% drop is $169 to $955.
The average is ZERO. The result is negative 4.5% ... or negative 1.125%/year. Reversing the up and down years renders the same result.
This results because Averages only work if the events are independent of each other. When one compares performance to averages it is an apples to oranges comparison.
One must look, NOT at average returns but CAGR (compound average growth rate), which takes into account this interdependence of events.
Let's take a microscope to recent events and see how it works, in real-time, not in theory:
For dramatic effect, I'll use the three year period of 2008, 2009 and 2010.
S&P Average vs. CAGR
| 2008 | - 36.55% |
| 2009 | + 25.94% |
| 2010 | + 14.82% |
| Average Annual Return | + 1.40% |
| CAGR | - 2.75% |
This differential represents a swing of over 4%. No wonder investors have trouble understanding how they lose money when the average seems to make money.
Examining the last 10 years, the "average return" of the S&P 500 was 9.05%, but the CAGR of the market was only 7.25%.
In fact, if we look at slices of returns over the last 100 years, we will find that Average Returns overstates CAGR by about 2% per year. WOW.
Here's a chart that shows the pattern for the S&P 500:
Average Returns vs. CAGR
| Average Return | CAGR | |
| 1928-2015 | 11.40% | 9.50% |
| 1966-2015 | 11.01% | 9.61% |
| 2006-2015 | 9.03% | 7.25% |
Remedy: There is a very simple remedy to this misconception. Do not use Average Returns, look instead to CAGR (compounded annual growth rate). That is the only way to judge performance.
Significance: This is a very significant distortion for a number of reasons. If we assume that long range historic returns are indicative of long range future results (I'm not saying they are ... that's for another article). If someone wants to project accumulation goals or withdrawals in retirement, they will severely overstate the results if they use Average Returns rather than CAGR. This is magnified as their projection will use compound interest on an overstated metric. Ye 'ole double whammy.
It also distorts inter-market comparisons, say comparing S&P to DJI or Nasdaq or Small Cap or whatever. When we are presented a distortion of reality, this distortion, when and if, compared to another distortion, well, two distortions don't make a right.
Let me move on to the next myth.
Inflation Rates:
No, I'm not going to argue about whether or not the metric used to determine the CPI or inflation rate is proper. I'm simply going to extend the argument I just made about Averages versus CAGR.
I'm going to save lots of typing by simply stating that when values are substantially unidirectional - that is they are mostly either up or down as opposed to up and down - an Average will understate, not overstate CAGR. Inasmuch as the last 60 years experienced only one year of negative inflation, it is certainly unidirectional.
We always hear about "some" Average Inflation Rate being XYZ. For instance, one Average Inflation Rate for the last 10 years was reported at 1.7%. However, that understated the CAGR when, using the exact same time period and rates would be closer to 1.9%.
Remember, this is statistical hocus-pocus which must be added to any hocus-pocus in the design of the metric, itself.
So, if anyone is wondering why they have trouble making financial progress it's very simple: returns for the market are statistically overstated and the inflation rate is statistically understated.
Moving on to the next myth.
Mean Reversion:
This is mostly used as a fancy way to say "What goes up must go down". In that context, it's more of a mis-application than a mis-representation. However, the effect is just as devastating, as it influences behavior that is inconsistent with maximizing returns.
When the market rises, as it has now, we hear a lot about mean reversion. This seems to make sense and play into the basic investor fear of a retrenchment. To better understand why mean reversion has nothing to do with this, let me start with an analogy.
We see an Olympic 100 meter swimmer dive into the water for her race. As she uses her left hand for the first stroke, she pulls slightly to the left. Then comes the right hand and that stroke moves her slightly back to the center-line. So, what we observe, is constant forward motion that travels in a jagged, or zig-zag, pattern.
Now, if the swimmer mean reverted, she'd go out to the 40 meter line, reverse course, swim back to the 20 meter line, reverse again to the 30 meter, reverse again to the 25 and so on ... back and forth .... until she settled near the 25 meter line and sunk in exhaustion.
So, the swimmer clearly doesn't "mean revert". Or does she? She actually does, but the mean reversion applies to the zig-zag, not the forward motion of the swimmer. So, the swimmer moves on towards the finish line ... the mean reversion (zig-zag) does not cause her to fall back ... just takes a little longer to get where she's headed.
It is the same with the market. The market shows mean reversion, not in the price of the market, but in the Growth Rate.
Let me give an example.
Assume the historic annual growth rate of the market is 8% and it is trading at $2,200. It goes up 14% to $2,500. Mean reversion of price would mean it would drop to $1,900 so the average price was $2,200.
However, mean reversion of the growth rate would lower future growth until that "excess" 6% is absorbed. Now, this could happen by growing 1% less (7%), for the next six years or growing only 2% the next year.
So, if growth rate mean reverts the market can go higher. It just goes higher at a slower rate to compensate for the excess growth.
THIS IS EXACTLY WHAT WE OBSERVE.
Mean reversion does NOT mean "what goes up must come down".
But, you ask, we all know the market goes up and down, isn't that mean reversion? Absolutely NOT ... in the sense it is vernacularly applied ... which is to imply the market will drop. It is the same pattern we observe in the zig-zag of the swimmer. The market mean reverts to its growth rate, not its price.
If you think about it you'll understand why there's always a bounce-back on a drop. Sometimes the bounce-back comes quickly, sometimes it's dragged out.
Significance: Yes, the market will go up and down. No one denies that. However, it will not mean revert to some previous price ... it mean reverts to a growth rate. So, we can witness an ever increasing market that is mean reverting at the same time.
Now, many will try to time the zig-zag, knowing that it is just a temporary condition. This can be done very successfully. However, those that sell or stay out of the market, expecting the price to mean revert generally find themselves losers. I know several that sold out in June 2013 when the S&P 500 hit $1,600. It was an "all time high" and surely would mean revert. Now, with the market nearly 50% higher, they are still waiting. Hope you're not one of them.
Summary: Many investors and even some professionals can be easily misled by what seems to be an accurate portrayal of market conditions. Very few actually have the training to understand the mechanics of the market. Most fall victim to "slogans" and misrepresentation.
This article illustrated how the market is systematically portrayed as being more robust than it really is ... that inflation portrayals use the same techniques to understate the true rate and that investors are wrongly influenced to sell when they should be holding or buying.
It is my hope, that through this article, I can challenge the reader to question even the most basic of "slogans" and accepted practice.
Caveat: In this article I put forth the concept that the Market has a "fundamental" growth rate around which it mean reverts. This is the current thinking amongst most statisticians and market gurus. There is a tremendous amount of scholarly articles and studies indicating this to be so.
Personally, I disagree with the "field" on this. My personal opinion is that the growth rate, itself, mean reverts around some other fundamental value or values that are not easily and currently understood.
Since I promised just a factual presentation and not a philosophical or "gut" opinion, it was beyond the scope of this article.
Courtesy of SeekingAlpha
Read More, Comment and Share......
On December 12, U.S. President Elect Donald Trump took to Twitter to rail against Lockheed Martin for the perceived waste of its next-gen fighter jet program. In his tweet, Trump said:
The F-35 program and cost is out of control. Billions of dollars can and will be saved on military (and other) purchases after January 20th.
— Donald J. Trump (@realDonaldTrump) December 12, 2016
Trump’s comments on the program's cost were made within the context of the government spending that his campaign promised to curtail, and as a heavy government supplier, Lockheed was an expected target. In fact, using FactSet’s Supply Chain data we can see that Lockheed receives a whopping 78% of its revenue from the U.S. government.

Given Trump’s predilection to delivering his thoughts directly to his followers and his promises to curb government waste, the Lockheed Martin tweets could be foreshadowing of a larger pattern of Trump-induced market reactions. To predict what other stocks could be the subject of Trump’s tweets moving forward, we found those that count the U.S. Government as their largest customers.
Using FactSet’s Revere data, we can see there are quite a few companies with huge exposures to the U.S. government; in fact, 27 companies attribute more than 80% of their revenue to the federal government. A further 250 companies generate a portion of their revenue from the U.S. Government. In addition, searching relationships data uncovers at least 35 companies with some level of connection to the F-35 program Trump mentioned.
Looking at the motivations that prompted Trump’s tweets about Lockheed, companies that could be targeted by the President-elect’s Twitter-based market shocks would likely be others in the aerospace or defense industry with a lion’s share of their revenues coming from government contracts. Mantech International Corp, Booz Allen Hamilton Holding Corp, Huntington Ingalls Industries Inc., and KEYW Holding Corp are all defense companies that derive over 90% of revenue from government sales and programs. That being said, it’s important to note that Trump’s comments were prompted by a specific program, rather than the percentage of revenue Lockheed Martin receives from the U.S. government.
Despite the obvious connection between government spending and the Aerospace & Defense industries, many of the organizations identified were not part of military program spending. Healthcare was another common area of government spending. Of the eight companies that generate 100% of their revenues from the government, seven are healthcare.
While no companies are necessarily safe from the unabated feedback of a socially connected world, with an agenda that seeks to trim that fat from government spending and a digital pulpit at his disposal, this is unlikely to be the last time Trump moves the market in under 140 characters.
Courtesy of Factset
Read More, Comment and Share......

The stock market went on quite a tear in the 3+ weeks immediately following the election, with the month of November especially beneficial for small-cap stocks.
Before delving into what it all might mean for small-cap investors, here's a quick rundown to help contextualize just how dynamic a month it was:
What drove small-cap value?
The strength of small-cap value has come from cyclical (and diverse) sectors including Financials, Industrials, Consumer Discretionary, Energy, and Materials.
Financials benefited from a steepening yield curve that should help to boost bank profits, while optimism about accelerating economic growth helped Industrials and many Materials stocks. The U.S. consumer has ratcheted up spending, and rebounding commodity prices helped both Energy and, again, Materials.
Small-Cap Cyclical Sectors Lead in November
Russell 2000 Sector Returns November 2016 and QTD

1Real Estate, formerly part of Financials, became a separate GICS sector on 8/31/16.
What does this mean for small-cap investors?
To be sure, this is all welcome news, especially for small-cap active managers with a cyclical tilt.
After such a remarkable run, it’s also understandable to ask, perhaps with a bit of trepidation, where small-caps go from here. We are contrarians, after all.

First, the current rally has exacerbated an already pronounced shift from growth to value while also solidifying a move from large-cap to small-cap.
The post-election environment has also seen a dramatic rotation away from safety—bonds and defensive stocks most notably. Investors have shown increased confidence in the potential for accelerated economic growth and a likely policy shift from monetary to fiscal—chiefly in the form of tax cuts and projected spending increases on infrastructure and defense.
How much of this is accurate and how much has already been priced in remain to be seen. Certainly, we see these as the critical questions to be answered going forward.
It is not uncommon for major events (political or otherwise) to create outsized, short-term swings that manage to correct themselves as the future becomes clearer. We would not be at all surprised to see a correction over the next few months.
After all, one result of the uptick is that many stocks now sport very high valuations based on these great expectations.
As always, we think certain fundamentals will continue to matter as the interest rate environment (and with it the economy as a whole) returns to a more historically normal (and, in this instance, possibly inflationary) pattern.
From our perspective as small-cap specialists, we see the key fundamentals going forward as earnings, profitability, the ability to self-fund, and valuations that we believe do not fully reflect these positive attributes.
We view small-cap value's leadership as still comparably new and that the cycle will remain favorable for both small-cap value and active approaches to the asset class.
Stay tuned…
Courtesy of Royce Funds
Read More, Comment and Share......
The S&P 500 Financials sector has been a focus sector for the markets in recent weeks. This past week, the Federal Reserve Board increased the target range for the federal funds rate. Earnings for banks and other companies in the Financials sector are particularly sensitive to higher interest rates. In addition, this sector has recorded the largest increase in value (+22.2%) of all 11 sectors in the S&P 500 since the start of the fourth quarter (September 30). Given these developments, have analysts been increasing their 2017 EPS estimates for banks and other companies in the S&P 500 Financials sector over the past few months?

The answer is yes. In terms of EPS estimate revisions, 38 of the 63 companies (60%) in the S&P 500 Financials sector have seen an increase in their mean EPS estimate for 2017 since September 30. At the sub-industry level, the three subindustries that have the largest percentages of companies that have recorded an increase in their mean EPS estimate for 2017 (since September 30) are all bank-related subindustries: Regional Banks, Investment Banking & Brokerage, and Diversified Banks.
Eleven of the 11 companies (100%) in the Regional Banks sub-industry have seen an increase in their mean EPS estimate for 2017 since September 30, led by Huntington Bancshares (to 0.94 from 0.88), Citizens Financial Group (to $2.18 from $2.06), and Regions Financial (to $0.95 from $0.90).
Four of the four companies (100%) in the Investment Banking & Brokerage subindustry have seen an increase in their mean EPS estimate for 2017 since September 30, led by Morgan Stanley (to $3.18 from $2.97) and Goldman Sachs (to 18.02 from 16.88).
Five of the six companies (83%) in the Diversified Banks subindustry have seen an increase in their mean EPS estimate for 2017 since September 30, led by Comerica (to 3.84 from 3.37) and Bank of America (to 1.64 from $1.54).
Download the latest insight.
Courtesy of Factset
Read More, Comment and Share......
If you're like me, we're all wondering what is going to occur with ACA (Obamacare) once Donald Trump takes office and the charts from Healthcare (XLV) and Biotech (XBI) certainly reflect the concern. With the proposed 21st Century Cures Act, due for Senate passage this week, be the $5Billion dollar "game changer" the sector is waiting for...........or will we be waiting until Congress replaces the unpopular components of Obamacare to see an impact in stock price?
Repealing or replacing Obamacare is fraught with at least six major issues, but perhaps the most significant one is a lack of decisiveness within the Republican party itself. What would Obamacare be replaced with, and how would that change be implemented?
Interestingly, there are at least seven Republican plans that have been tabled to replace Obamacare. Within that group, two of the more prominent ones come from Georgia Rep. Tom Price and House Speaker Paul Ryan.
Tom Price, who is Trump’s pick as the incoming secretary for the Department of Health and Human Services (HHS), has already published his consumer-driven healthcare model, and it already exists in legal language. In additional, Paul Ryan released his own proposal in the form of the A Better Way plan earlier this year, which also touches on other issues such as poverty, national security, and the economy.
Despite the number of options, the problem is that no one can agree on a particular solution. The party is heavily divided, and Trump is already receiving heavy blowback from the Tea Party faction for telegraphing potential delays in repealing or replacing the act.
Yes, the future of U.S. healthcare is murky – even to Trump and the GOP. However, what is clear is that with most chips stacked in the Republicans favor over the coming years, it is unlikely that they will miss the opportunity to initiate the post-Obamacare era in some shape or form.

Read More, Comment and Share......
Imagine shopping with no lines and no check out? All you need is a smart phone with the AMZN app and you're ready to go. Welcome to Amazon Go. The first Amazon Go store in Seattle sells ready-to-eat meals, snacks and locally-prepared bakery items but just imagine if this came to your local grocer? Amazing what technology will bring.
Read More, Comment and Share......
Some may say that technical analysis is 'bunk' but it's just that which caused me to short AMZN. Now you can say they're #1 when it comes to online sales but my question is, has their growth hit a plateau? Trading at 170x p/e, anything is possible. (click chart to enlarge). Talk is that MSFT is bringing the smart home to Windows. The feature will allow Cortana to be summoned on any Windows 10 PC lock screen. It's expected to appear in Win 10 updates starting in 2017 and this software-only feature could trump AMZN Echo and GOOG Home due to the obvious convenience of screen access. From an investor point of view, I would definitely take some off the table at this point and invest it in banks, industrials and insurers. But let's take a look at sales. No growth in 2016? Now that's interesting.
Amazon sports some pretty startling numbers. Let’s dive into various reports for a close look.
Amazon captured 31% of online spending over Cyber Weekend

CNBC reports Amazon captured 31% of online spending over Cyber Weekend
According to new data by Slice Intelligence, which scanned more than 1 million online shopping receipts from Thanksgiving through Cyber Monday, Amazon accounted for 30.9 percent of sales. It was followed by Best Buy at 7.4 percent, Target at 4.4 percent, and Wal-Mart at 4.1 percent.
Amazon Prime
Barrons reports Amazon Prime Grows to 50 Million Members
Amazon’s Prime membership is up 23% from a year ago, according to new data from Cowen & Co.
Amazon.com doesn’t disclose its Prime membership count, so Cowen bases its estimate off a panel of 2,500 U.S. consumers. Some 45% of that panel now has Prime, which translates to 49.5 million total consumers, Cowen estimates, up 23% from a year ago, when the firm estimated 40 million Prime subscriptions.
Prime costs $99 a year. It gives Amazon shoppers free two-day shipping, plus free access to the company’s growing library of streaming TV and music.
Other Data from Cowen’s Report
Online and Mobile Sales
The Chicago Tribune reports Cyber Monday sales spike 9.4%, early data show.
Black Friday Record Breaking Sales Online
Tech Crunch reports Black Friday online sales to hit a record-breaking $3 billion, over $1 billion from mobile.
Online Sales Growth
In 2015 Amazon accounted for 60% of U.S. online sales growth.
Amazon.com Inc. generated about 60% of total U.S. online sales growth in 2015 far outpacing the competition, according to data compiled by Forrester Research.
The retail giant tallied $23 billion more in U.S. e-commerce sales in 2015 than 2014, the report found.
“Amazon makes up a larger percentage of e-commerce in the U.S. than any other player, and its retail growth has outpaced overall online retail,” Forrester Research wrote in a recent report, titled “U.S. Online Retail Forecast: 2015 to 2020.”
Amazon Share Price Stats

Above data from Yahoo Finance.
Amazon Stats Synopsis

Good companies don’t necessarily make good stocks.
Courtesy of Mish
Read More, Comment and Share......
When Americans started celebrating Thanksgiving in the 19th century, it was about cherishing the blessings of the year, particularly the year’s harvest. These days however, it appears as if many people spend the holiday thinking about what they might need rather than what they already have.
Over the past few years, Thanksgiving weekend has grown to become a huge shopping extravaganza both on- and offline. Retailers try to outdo each other in offering the best Black Friday / Cyber Monday deals and consumers willingly jump at the chance to kick off their holiday shopping and snap up some bargains.
Not surprisingly, this year’s Thanksgiving weekend saw online shopping records shattered once again. According to Adobe Digital Insights, total online sales for the five-day period from Thanksgiving through Cyber Monday amounted to $12.8 billion, with Cyber Monday marking the single biggest online shopping day in history. Black Friday and Cyber Monday were also the first days in history that cracked $1 billion in mobile sales. Interestingly, mobile sales have shifted from tablets to smartphones over the past two years, mirroring a broader trend that saw the popularity of tablets fade in favor of large-screen smartphones.

You will find more statistics at Statista
Read More, Comment and Share......