
You know those moments.......when you were at a family function or out for a few cocktails with friends when someone brought up the topic of the economy or stock market. Those conversations were fairly easy to side step and ensure you'd still be on speaking terms tomorrow. The last five years, however it's an entirely new ballgame and avoidance is not becoming any easier. I think the basic problem for the general public (and many small investors) is that they expected a snap back in jobs in 2-3 years, as is normal after a recession. The problem isn't the current administration. The problem is that we didn't simply experience a recession. We experienced a global financial crisis which is a horse of an entirely different color.
You really can't blame them for not understanding the difference between the two. Most haven't been alive long enough or have knowledge of economic history to realize the ramifications. According to a White House Crisis and Recovery in the World Economy "Although economic dislocations have been severe in one region or another at various times over the past 50 years, never in that time span has the annual output of the entire global economy contracted." The end result boys and girls is not a 2-3 year rebound. The Washington Post warned: housing prices tend to be depressed for years, and credit deleveraging takes about seven years. Additionally, real per capita GDP growth is significantly lower in the decade following a financial crisis. Even today with global central banks easing, the recovery is far from over according to Bloomberg. So where are we truly in the deleveraging process? Roubini Global Economics breaks it down. Enjoy-
By Christian Menegatti and David Nowakowski
Roubini Global Economics
• Question: Are U.S. households done deleveraging? Answer: Getting there; thanks to consumer credit rebounding, household debt increased in Q2 2012, for the first time since 2008, although it dipped again in Q3. Consumer credit held up with a significant acceleration in the pace of releveraging in 2012. Mortgage debt is still shrinking, as homeowners seek to rebuild equity or default.
• Question: Why does it matter? Answer: It matters because deleveraging acts like gravity on economic activity, with repayment of debt sopping up income that would otherwise go into consumption and housing. The good news is that the housing market is looking a bit brighter after five years of residential investment contraction and will provide a significant contribution to GDP growth going forward. However, the welcome housing reflation will be too weak to boost the asset side of household balance sheets and consumption through wealth effects.
• The financial sector is still deleveraging rapidly, partly as securitization markets and government enterprises continue to shrink. Corporations and small businesses are both leveraging up; the former robustly (although nowhere near the pre-2008 pace), the latter anemically. Unfortunately, this borrowing seems to be mainly for refinancing, cash hoarding and equity buybacks, along with some investment in capital stock, but little hiring.
• Question: What does it mean for economic activity and asset classes? Answer: The end of private- sector deleveraging, and, eventually, credit growth increasing to the level of economic growth, will boost U.S. growth closer to its potential rate of 2.5-3.0%. It will allow for slower savings growth, more investment and smaller fiscal deficits. Unlike Japan, which remains in deleveraging mode decades after its bust, the U.S. seems close to ending this painful period of balance-sheet repair, and avoiding the lost decades of ZIRP and dismal equity market returns that come with it.
Here Is How the Story Goes...
RGE’s focus has always been on national balance sheets and the signals of health or sickness that those can send. In this case, the patient is the U.S. economy; the Flow of Funds Accounts of the United States (the Fed Z.1 report) is our quarterly doctor’s visit. U.S. households are very familiar with deleveraging; associated with an economy that will take a long time to return to potential growth and full unemployment. But is the medicine working?
Being in the postcrisis, Minsky-moment aftermath makes us the lucky witnesses of a once-in-a-generation event (one hopes). After over 60 years of almost monotonic growth in the U.S. total debt-to-GDP ratio, the Great Recession unleashed a painful deleveraging process that depressed private demand and pushed policy makers into several rounds of fiscal and monetary stimuli. While fiscal stimulus (a.k.a., releveraging of the public sector to offset the private-sector deleveraging cycle) is now turning into a drag on growth and source of uncertainty, and potentially a heavy one, the Fed has made its open-ended monetary easing stance contingent to labor market performance. Monetary policy can ease financial conditions and can build a bridge to a “better day” (a day in which deleveraging and uncertainty are gone), bu t it is the progress of balance-sheet repair of the household and financial sectors that will actually bring that “better day” a bit closer—the Fed has decided to extend the bridge as long as needed, conditional on inflation (actual and expected) developments.
So, Is Private-Sector Balance-Sheet Repair Over? And Is That ‘Better Day’ on the Horizon?
Pages 8 and 18 of Z.1 tell us that, in Q2 2012, total household credit flows printed a positive number, to the tune of $161 billion, for the first time since Q1 2008 (with the exception of a tiny blip in Q4 2011). That is a far cry from the average quarterly total household credit contraction that we lived with between Q2 2008 and Q1 2012. Unfortunately, Q3 2012 did not repeat the expansion of Q2. With a contraction of $262 billion, Q3 2012 was a bit worse than the average quarterly flow of the last four years. So, almost five years since the official beginning of the Great Recession, how far are U.S. households, in aggregate, into their deleveraging process?
Total Household Credit: Good News and Bad News
Without oversimplifying much, we can break down total household credit into consumer credit and mortgage credit. The good story is in consumer credit; the not so good story in on the mortgage side.
Consumer Credit
Household consumer credit collapsed heavily post-Lehman and relapsed two years later, starting in late 2010, displaying an almost V-shaped recovery (Figure 1). The flow for Q3 2012 ($116 billion) was a bit weaker than in Q2 ($173 billion) but, nevertheless, the trend remains positive and intact.

Source: Federal Reserve
Mortgage Credit
Mortgage flows are still bad news and have been in negative territory since Q2 2008 (Figure 2). The mortgage sector remains stuck in deleveraging mode, even with home affordability at an all-time high. In H1 2012, flows of mortgages obtained by households were as bad as they have ever been since the beginning of this crisis—it does not look like there is much of an improvement there yet. Most likely, this is not just due to the supply side (the broken banking-credit-market channel that the Fed is trying to fix); the demand side is not yet feeling like loading up debt to buy a home.
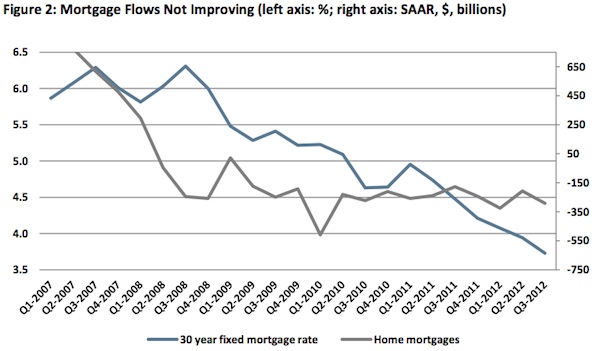
Source: Federal Reserve and Federal Home Loan Mortgage Group
So, How Are U.S. Households Feeling?
Home equity was allegedly an important driver for consumption (and consumer credit growth) and sentiment (Figure 3). The good news is that home equity as a percentage of household real estate is improving, albeit very slowly, after the collapse of 2007. As homeowners gradually rebuild equity through repayments, and if home prices, after triple-dipping, start to recover in line with inflation, this long-time drag on economic activity could fade within the next year.
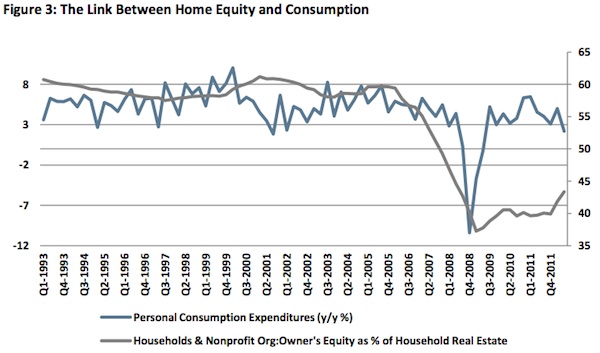
Source: Bureau of Economic Analysis and Federal Reserve
Stocks: Housing Matters...
So far, we have only discussed flows. Looking at stocks (levels) gives us a better sense of where we are in the debt/asset journey. Housing is by far the largest single asset on the balance sheet of U.S. households (about $19 trillion out of $78 trillion of total assets). Clearly, U.S. households’ wealth effects and net worth depend a lot on what happens to home prices, where the future for both prices and quantities looks a bit brighter. RGE expects housing starts to grow by a whopping 30% in 2013 and to reach the 1.1 million mark at year-end (annualized rate; housing starts peaked at over 2.2 million in early 2006). Although residential investment is just about 3% of U.S. GDP, and therefore its contribution to growth is limited (about 0.4% in 2013), a housing recovery would have a positive multiplier effect and give a push to housing-related consumption.
The recent trajectory of growth in starts would suggest an even faster pickup. Estimates of housing needs are consistent with starts increasing to well over 1 million, and moving closer to 1.5 million-1.8 million eventually— depending on demand for second homes, capital replacement and household formation, including assumptions on immigration. That number might be a bit high given household formation collapsed during the recession to below 500,000 per year, from the 1.7 million per year in the decade prior to 2007, but a catch-up does need to take place, although some of it may be in rentals (multi-family or commercial real estate) rather than single-family starts.
On the price side, we forecast nominal house price gains of 4.0% in 2013 and 5.2% in 2014. This pace of housing reflation is insufficient to bring significant positive wealth effects; although $1.75 trillion of additional property wealth is nothing to sneeze at, it only makes up for a fraction of the value “lost” in the housing bust. However, the improvement will boost the sentiment of all those households that remain in negative equity, with no income or no income growth and with a high ratio of debt to disposable income that will force them to continue their deleveraging process. And those households might happen to be those with the highest propensity to consume.
In fact, it is overall wealth, arguably, that needs to be restored to something like its previous level before savings, leverage and consumption patterns are able to return to a more “normal” state. Figures 4 and 5 show that, despite the rebound in equity markets, household net worth in nominal terms is now probably back at its precrisis high of around $67 trillion, but still far off the precrisis trend. On another measure, wealth is at 5.5x income; much improved from 2009, but still only at the levels seen early on in the 1995-2000 “Clinton” and 2003-08 “Bush” recoveries. There is no clear-cut answer as to what wealth ought to be, and demographics and inequality may also play a role. But, after four years of deleveraging, the asset side of the balance sheet seems in good enough shape not to be an obstacle to credit growth. Could something else be holding it back?
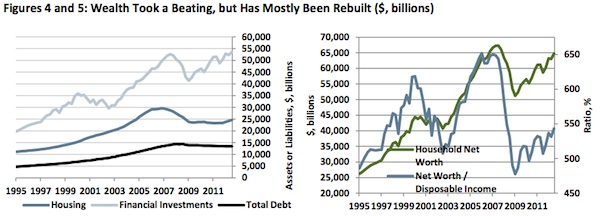
Source: Haver, Federal Reserve
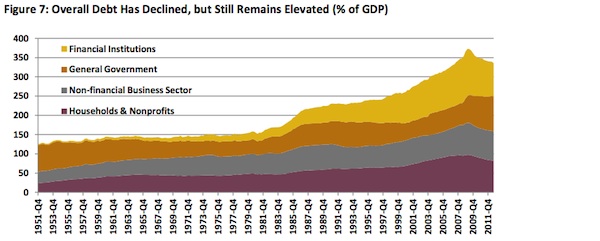
As Figures 6 and 7 indicate, deleveraging on the private side of the economy has been the flip side of the large government deficits. (In fact, the urge to save and the need to default—rather than stimulus—is the main cause of the sustained slump that is in turn the main cause of the reduced revenues and thus the fiscal deficits.) Figure 6 suggests that, compared with the post-World War II trend of rising household indebtedness, the recent debt reduction is already enough. But there is no financial or economic argument for this trend being the right long- term equilibrium. If wealth and income levels are back to mid-1990 levels, and economic uncertainty at 1970-90 levels, then household indebtedness might be more appropriate at 65% of GDP or even 50% of GDP. Even if the current pace of GDP growth combined with defaults and savings continues, it would take until 2016 or 2019 to reach those levels once more.
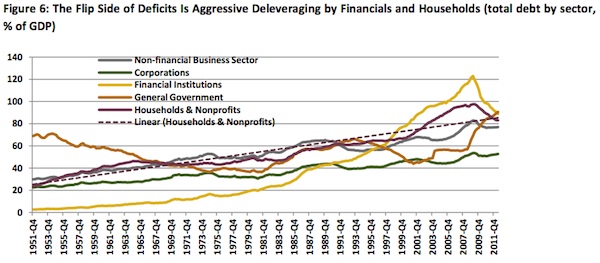
Source: Haver, Federal Reserve
Source: Haver, Federal Reserve
A potential problem with the above estimates (indeed, with using debt/GDP or debt/income at all) is that they compare stocks with flows, and the resulting numbers are not just percentages, but should be given the correct units, which are “years.” There is no reference to the cost of the debt, its maturity, assets or growth of GDP.
One additional and useful measure would be the amount needed to service the debt. The Fed measures this by dividing the estimated payments on debt (inc. principal; e.g., minimum payments on credit cards and mortgage amortizations) by disposable personal income. In this way, longer maturities and lower real interest rates are better captured—and the result looks dramatically different, as shown in Figure 8. At 10.6% of income, the actual burden of debt is as low as it was in the early 1980s and early 1990s, after recessions and rate cuts. The broader measure, which includes auto lease payments, rent, homeowner’s insurance and property tax, is likewise near its historical troughs (below 16% of income, down from 19% in 2007). Although there was not the dramatic net deleveraging the U.S. is experiencing now, after a period of 4 years in the first case and 2.5 years in the latter, robust growth and leveraging were ready to begin again, and even tolerate aggres sive hiking cycles. However, in the early 1980s and 1990s, inflation (and nominal GDP) was running at over 10% and 6%, respectively—that has not been the case during this deleveraging episode.
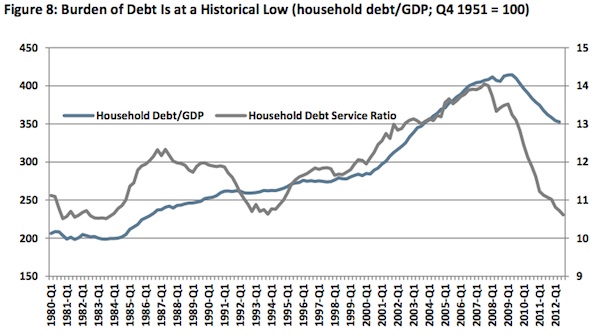
Source: Household Debt Service and Financial Obligations Ratios and U.S. Flow of Funds reports, Federal Reserve
Enter the Fed
The Fed is determined to push on a string until a significant improvement in labor-market conditions comes about. This will help nominal growth (rather than real), which seems to be the goal/target at this point (and not just for the Fed)—and also hopefully the achievement of an even more beautiful deleveraging..., comparing and contrasting with that of Japan for example (Figures 9 and 10).
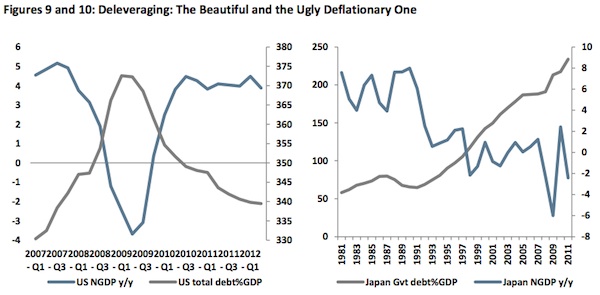
Source: Bureau of Economic Analysis, U.S. Treasury, Bank of Japan and Cabinet Office of Japan
QE3 will help prompt another wave of refinancing, but will it unlock the credit channel? The other not so good news on page 8 of the Fed’s Z.1 report is that the domestic financial sector is still in deleveraging mode (Figure 11).
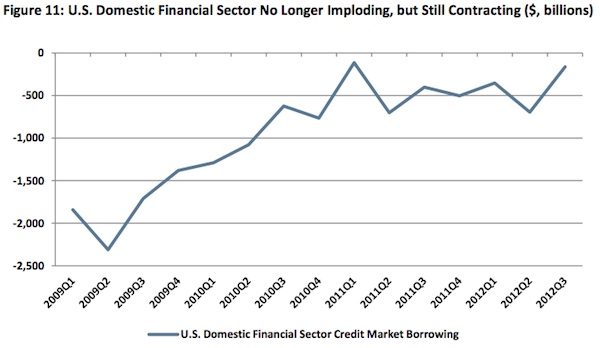
Source: U.S. Flow of Funds, Federal Reserve
It is important to remember that deleveraging is a vague term, if not a euphemism. Although it can take place through the saving and repayment of debt, it is also possible through other processes: Namely, default and inflation/growth. While nominal GDP growth is anemic, time is an important factor in the healing process. Defaults, on the other hand, are quick, but painful. And there has been plenty of pain to go around, but it is largely abating (Figures 12 and 13). In particular, after the spurt of subprime and Alt-A defaults that were inevitable, the bottoming out of housing, the belated and poorly implemented HARP programs and the weak recovery have stabilized mortgage defaults and foreclosures. If there is one sector to be worried about, it is student loans. Although these loans are largely a federal exposure and total a mere $ 1 trillion (and so unlikely to trigger a systemic financial explosion), the sector is now bigger than auto loans or credit card debt, and is likely to be a dual burden on the current crop of college graduates, together with joblessness and underemployment.
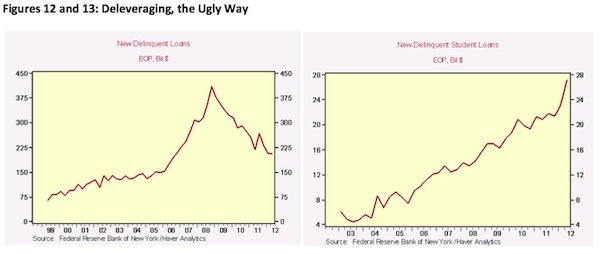
Source: Federal Reserve Bank of NY, Haver
Conclusion
From a balance-sheet perspective, the U.S. household sector is coming to the end of its period of deleveraging that began in 2008. Wealth has been rebuilt (Figures 4 and 5), debt has been cut through defaults and repayment, and incomes have recovered (Figure 14 shows the detailed decomposition of this process). As long as interest rates remain low, and deflation is avoided, a more normal period may soon begin, although debt levels in some sectors remain high. As households join corporates in borrowing (at a rate, one hopes, more in line with incomes and demographics), consumption and investment (residential and capital) will support a rate of GDP growth that will gradually return to the potential level, even as the baton is passed from government income support and generous tax cuts. But important questions to keep in mind, which we will address in forthcoming analysis, include the following:
• What will happen to real wages, disposable income growth and savings?
• Will the mini releveraging cycle, helped by low real rates and painstaking repayment, be killed off by the fiscal adjustment in the U.S. (even if the austerity is not as severe as it might have been under a full “cliff” scenario)?
• Will recession/slowdown in the eurozone and China damage corporates and banks via financial conditions and sentiment, or hurt household balance sheets via the equity markets?
• And even if assuming that deleveraging in the private sector is over in aggregate and across different types of liabilities, what will credit growth look like in the U.S. in the near future, and to what levels will leverage converge in the medium term... and what would that mean for growth?

Source: RGE
Source: RGE, Bloomberg, Federal Reserve Bank of St. Louis FRED
Reprinted with authorization from John Mauldin Outside The Box http://mauldineconomics.com

Comments